Zeta potential is an important parameter in understanding the electrostatic repulsive forces present in a colloidal dispersion or a molecular solution. The magnitude of the zeta potential value can provide valuable insight into the potential stability of a colloidal system. The technique of electrophoretic light scattering is commonly used to measure zeta potential and is available in the Zetasizer Advance series of instruments.
This technical note discusses zeta potential method development and highlights various factors that need to be considered, from instrument verification, sample preparation, measurement set up and result analysis.
Login or create an account to read more.
Zeta potential is an important parameter in understanding the electrostatic repulsive forces present in a colloidal dispersion or a molecular solution [1-5]. The magnitude of the zeta potential value can provide valuable insight into the potential stability of a colloidal system [6,7]. The technique of electrophoretic light scattering is commonly used to measure zeta potential and is available in the Zetasizer Advance series of instruments.
This technical note discusses zeta potential method development and highlights various factors that need to be considered, from instrument verification, sample preparation, measurement set up and result analysis.
An electrophoretic light scattering (ELS) instrument uses first principles in its measurement protocol i.e. it cannot be calibrated, but should be verified that it is working correctly by measuring a sample with a known zeta potential value. The frequency of instrument verification should be defined by the user.
A positively charged sample (Standard Reference Material (SRM1980)) is available from the National Institute of Standards and Technology (NIST). This is a goethite suspension and must be prepared according to the procedure supplied by NIST. If the Smoluchowski approximation is used, it will give a zeta potential value of +32mV ± 1.5mV.
Currently, NIST do not have any negatively charged samples for instrument verification purposes. However, there are negative zeta potential transfer standards available. ZTS1240 is a zeta potential transfer standard available from Malvern Panalytical and is supplied as a ready to use syringe for instrument Performance Validation on any ELS capable Zetasizer instrument.
The system of transfer standards is often used to reduce the cost of using standards, or to use a material that is more closely related to the sample of interest. In this case the accepted standard, NIST 1980, is not ideal as it has a positive zeta potential. This means that it will adhere to components in the system, such as the folded capillary cell, which has a negative wall zeta potential. ZTS1240 has a negative zeta potential and is easy to flush from the system. It has a mean value of -40mV with minimum and maximum limits of -45.8mV to -34.2mV respectively.
The Zetasizer Advance range of instruments has various cells options available for the measurement of zeta potential. The choice of cell will be dependent upon the application.
Table 1 summarises the cells available for the measurement of zeta potential with the Zetasizer Advance series. The folded capillary cell and the high concentration cell can be used with the Multi-Purpose Titrator 3 accessory.
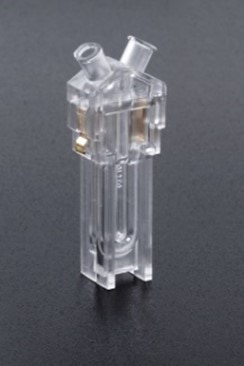
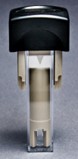
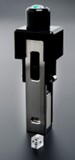
The folded capillary cell is disposable which avoids the possibility of contamination between samples. The dip cell and high concentration cells require thorough cleaning between samples to ensure that there is no cross over contamination. All three cells can be used for aqueous samples. However, only the dip cell can be used non-aqueous applications. This is required because of its chemical compatibility and the close spacing of the electrodes which allows the generation of high field strengths without using excessively high voltages. The folded capillary cell can be used for some dispersants such as ethanol or propan-2-ol which have relatively high dielectric constant values.
It is advised that the same dip cell is not used for both aqueous and non-aqueous samples, as trace amounts of water can influence the zeta potential values obtained with non-aqueous samples.
| Cell Type | Folded Capillary Cell
| Dip Cell
| High Concentration Cell
|
| Application | Aqueous | Aqueous/Non aqueous | Aqueous |
| Material | Polycarbonate | Plastic, glass or quartz cuvette | Glass |
| Electrodes | Gold plated | Palladium | Palladium |
During a zeta potential measurement, the incident laser beam passes through the center of the cell containing the sample and the scattered light is detected at a forward angle. Therefore, in general, samples for zeta potential measurements must be optically clear. The minimum and maximum sample concentrations that can be measured will depend on the optical properties of the particles, the particle size and the polydispersity of the particle size distribution. The lower and upper limits of concentration for zeta potential measurements are not easy to define and should be determined experimentally by measuring the sample at different concentrations and seeing the effect on the data quality obtained [8].
The minimum count rate of scattered light required to make a measurement is 10 kilo counts per second (kcps) above the dispersant scattering level. Therefore, the minimum concentration required will depend upon the relative refractive index (the difference in refractive index properties of the particle and the medium) and the particle size. The larger the particle size, the more scattered light it produces and hence the lower the concentration that can be measured. The minimum concentration required for successful zeta potential measurements of a particular sample should be determined experimentally.
The maximum concentration for a zeta potential measurement in the Zetasizer Advance series is not easy to define. The factors discussed above all have to be taken into account i.e. the particle size and polydispersity and the optical properties of the sample. As the scattered light from a sample in a zeta potential measurement is detected at a forward
angle in the Zetasizer, the laser beam must penetrate through the sample. If the concentration of the sample becomes too high, the laser beam will become attenuated by the particles, reducing the scattered light being detected. To compensate for these effects, the attenuator position in the instrument will be adjusted to a higher index i.e. a higher transmission.
The reduced path length of the High Concentration cell allows for measurements at higher concentrations to be made compared to either the folded capillary or dip cells. The concentration limits of any sample should be determined experimentally by measuring the sample at different concentrations and noting the effect on the zeta potential values obtained.
The dilution of any sample for zeta potential measurement should be done very carefully because the zeta potential is as dependent upon the chemistry of the disperse phase as it is upon the particle surface itself [9]. The aim of sample preparation is to preserve the existing state of the surface during the process of dilution [10]. There is only one way to ensure this is the case and this is by filtering or centrifuging some clear liquid from the original sample and using this to dilute the original concentrated sample. In this way the equilibrium between surface and liquid should be perfectly maintained.
If extraction of a supernatant is not possible, then just letting a sample naturally sediment and using the fine particles left in the supernatant is a good method, as zeta potential is not a size dependent parameter. Another method is to imitate the original medium as closely as possible, with regards to pH, total ionic concentration of the system and the concentration of any additives that may be present [3].
A common mistake made with sample preparation is to dilute the sample in deionised water. This is acceptable if the original, concentrated sample is prepared in deionised water. However, if the disperse phase contains electrolyte, additives etc, dilution in deionised water will fundamentally change the characteristics of the sample. In addition, zeta potential measurements in deionised water are not recommended for two reasons. Firstly, from a practical perspective, when a voltage is applied, the field produced needs to be stable and homogenous. This is difficult to achieve without the presence of ions and it is recommended to have some electrolyte present, even if at low concentrations. For example, 0.1mM NaCl or KCl etc [3]. Typically, zeta potential measurements of samples prepared in DI water are not very repeatable. Secondly, from a theoretical perspective, the zeta potential is a measure of the charge at the slipping plane which is located within the electrical double layer [1-5]. When working in DI water with its low conductivity, the electrical double layer will be ill-defined, and interpretation of what zeta potential means in this case is challenging.
Sample preparation for non-aqueous samples will follow the same general rules as for polar systems. As there will be generally fewer ions in a non-polar dispersant to suppress the zeta potential, the actual values measured can seem very high, as much as 200 or 250 mV. In such non-polar systems, equilibration of the sample after dilution is often the time dependent step [11].
This section discusses the setup of zeta potential measurements in ZS Xplorer software.
To set up a measurement, the following steps need to be completed:
Figure 1 shows the basic sample information which need to be filled in which is summarised in Table 2.
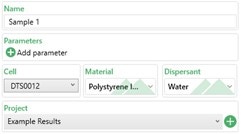
Figure 1: Basic sample information
| Setting | Description |
| Name | This is the name the sample will have in the results. |
| Parameters | Any custom parameter to the sample can be added to this box (e.g. batch number) which can be used to help filter results later on. |
| Cell | The cell type to be used for the measurement. For zeta potential measurements, either a folded capillary cell (DTS1070), dip cell (ZEN1002) or high concentration cell (ZEN1010) needs to be selected depending on the application. |
| Material/ Dispersant | The material and dispersant used in the sample should be selected from the dropdown list and specified here. The material optical properties are not used in any calculation during zeta potential measurements.
The F(ka) model (Henry’s function) to be used is linked to the dispersant selected. For aqueous dispersants, Smoluchowski is used by default i.e. F(ka) = 1.5 |
| Project | Select which project the results are to be added to or create a new project. |
Click or drag a Zeta step to add it to the Method Builder and select the number of repeat measurements to be performed (Figure 2). It is recommended that a minimum of 3 or 5 measurements are taken to check for result repeatability.
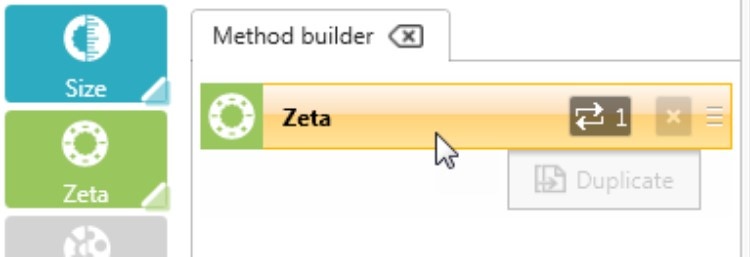
Figure 2: Adding a step to the method builder
The Measurement Properties box allows the temperature settings for the measurement to be defined (Figure 3). Further details are summarized in Table 3.
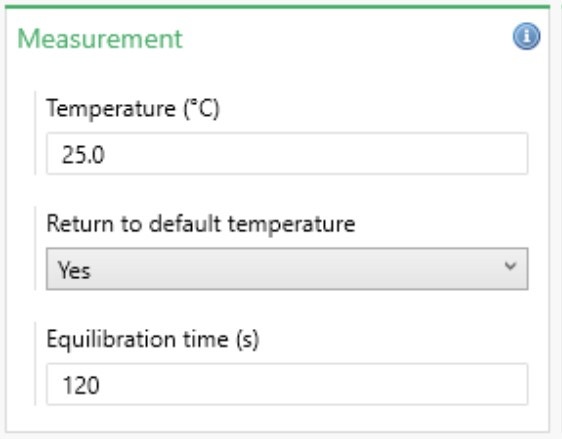
Figure 3: Measurement properties
| Setting | Description |
| Temperature | The temperature at which to perform the measurement. The default temperature is 25 °C. The upper limit is affected by the cell type and the dispersant used. |
| Return to default temperature | Returns the instrument to 25 °C once the measurement is complete if Yes is selected. |
| Equilibration temperature | The length of time given for the sample to thermally stabilize once it has reached the specified temperature. 120 seconds is the default, but this can be adjusted as required. |
The most appropriate analysis model for the sample being measured needs to be selected in the Data Processing box (Figure 4). The default option is Auto Mode. Table 4 summarizes the analysis models available.
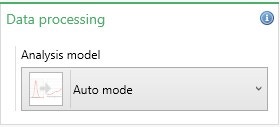
Figure 4: Analysis model selection
| Setting | Description |
| Auto Mode | In Auto-mode, the software automatically selects the most appropriate analysis model to use based on the cell type chosen, dispersant properties, and measured sample conductivity. This is the default setting for zeta potential measurements. |
| General Purpose | Provides a mean zeta potential value and distribution. This should not be used for samples in high conductivity dispersants (i.e. >5mS/cm), where fast measurements are required, with protein samples and diffusion barrier measurements. |
| Monomodal | Only provides a mean zeta potential value i.e. no zeta potential distribution is obtained. This analysis model is designed to reduce the energy imparted on the sample during the measurement to help maintain sample integrity. |
There are a number of advanced settings available in ZS Xplorer software (Figure 5) and these are summarized in Table 5.
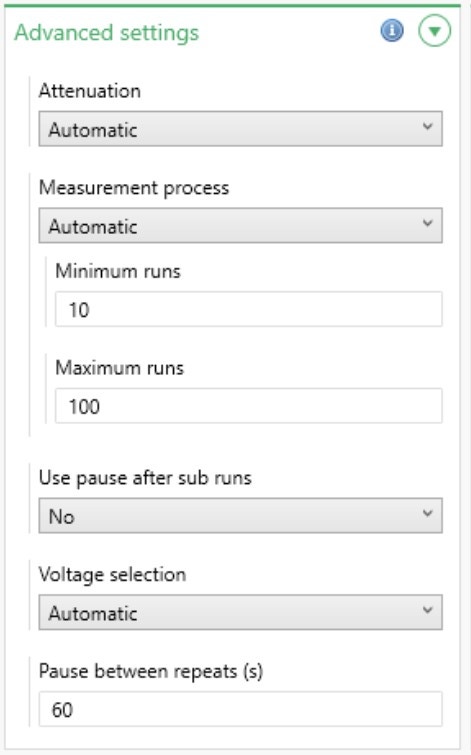
Figure 5: Advanced zeta potential settings
| Setting | Description | |||||||||||
|---|---|---|---|---|---|---|---|---|---|---|---|---|
| Attenuation | Select the attenuator level to use. This can be found automatically or fixed at a specific level. It is recommended to use the default setting, Automatic, during method development so that the optimum level can be found. The attenuation range is shown below; the transmission value is the percentage of laser light that enters the sample cuvette. | |||||||||||
| Attenuator index | 1 | 2 | 3 | 4 | 5 | 6 | 7 | 8 | 9 | 10 | 11 | |
| %Trans-mission
| 0.0003 | 0.003 | 0.01 | 0.03 | 0.1 | 0.3 | 1 | 3 | 10 | 30 | 100 | |
| Measurement process | Choose between Automatic and Manual. If Automatic is selected, specify the minimum and maximum number of runs the software is allowed to carry out. If Manual is selected, specify the exact number of runs to carry out. | |||||||||||
| Use pause after sub runs | If Yes is selected, the length of the pause after each sub run can be specified. | |||||||||||
| Voltage selection | It is recommended to leave this on Automatic during method development so that the optimum voltage setting can be found. Choosing Manual will enable an exact voltage to be specified. The voltage range is cell dependent. | |||||||||||
| Pause between repeat(s) | Adds a pause between repeat measurements of a specified length. This allows the sample to re-equilibrate between measurements. The default time is 60 seconds, and it is recommended that this is the minimum pause which should be used. | |||||||||||
When the Method is set up and ready to be run, click the Start method button (Figure 6).

Figure 6: Starting a method
Zeta potential measurements become more challenging with increasing sample conductivity. This is due to a number of factors which include Joule heating, electrode blackening (degradation), sample degradation (aggregation) and electrode polarization. This is particularly challenging when measuring proteins, as the measurement could lead to denaturation.
The automatic settings used in the software try to minimize these potential problems as much as possible. However, the use of the diffusion barrier technique will further help in minimizing any effects of the application of the field on the zeta potential results obtained [12-15]. The diffusion barrier method is a patented technique to ensure that the integrity of the sample is maintained during the measurement [12].
In the diffusion barrier technique, a small plug of sample e.g. 20 to 100μL (depending on practice), is introduced into a folded capillary cell containing the same buffer that the sample is prepared in and is therefore isolated from the electrodes. The physical distance between the sample and the electrodes means that the sample is protected. The diffusion barrier method has two advantages (1) the sample is never in contact with the electrodes and its integrity is maintained (2) much smaller sample volumes are required to perform the measurements.
It is recommended that the diffusion barrier method is used for any sample whose conductivity is greater than 5mS/cm [12-14]. ZS Xplorer automatically uses constant current mode for conductivities greater than this and, together with the use of the diffusion barrier method, allows measurements to be performed at very high salinities without sample degradation and/or bubble formation [16].
For a Zetasizer Pro or Ultra instrument, a method can be set up where size measurements are performed before and after the zeta potential measurements (Figure 7). In the example shown, 3 size measurements are performed before and after 5 zeta potential measurements. The integrity of the sample can be confirmed by comparing the count rates, z-average diameters and polydispersity index values before and after the measurement of zeta potential. Consistent results confirm that the sample has not changed during the measurement of zeta potential.
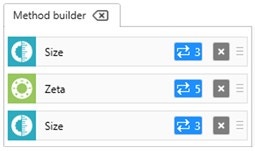
Figure 7: Method builder showing how size measurements before and after zeta potential measurements can be set up to check for sample integrity
Various parameters and reports are available in ZS Xplorer which will aid the interpretation of the results. Further information on zeta potential result interpretation can be found in a technical note on the Malvern Panalytical website [17].
The precision (repeatability) of the zeta potential results obtained is a key parameter in the analysis of the data. For a suitable sample, the precision (repeatability) of the zeta potential means would be expected to be better than 10% [9]. In addition, monitoring the conductivity and zeta deviation values obtained from repeat measurements can provide insight into the stability of the sample during the measurement process.
For samples where the repeatability of the results is poor, improved results could be achieved by averaging the records. This should increase the quality of the underlying raw data and subsequently improve result repeatability. In ZS Xplorer software, automatic averaging can be set up as part of the measurement (Figure 8) or, results can be averaged once they have completed by either selecting the required records, right-mouse clicking and selecting the Create Average Result option (Figure 9) or clicking on the Create Average Result button (Figure 10).

Figure 8: Automatic zeta averaging can be set up as part of the measurement

Figure 9: Results can be averaged by selecting them, right-mouse clicking and selecting the Create Average Result option

Figure 10: Results can be averaged by selecting them and clicking on the Create Average Result button
This technical note has discussed zeta potential method development and highlighted the various factors that need to be considered. These include cell selection, instrument verification, sample concentration requirements, sample dilution, measurement set up and result analysis.
[1] Hunter, R.J. (1988) Zeta Potential in Colloid Science: Principles and Applications, Academic Press, UK.
[2] Shaw, D.J. (1992) Introduction to Colloid and Surface Chemistry, Butterworth Heinemann, UK.
[3] Measurement and Interpretation of Electrokinetic Phenomena (2005) Pure Appl. Chem. 77, 1753-1805.
[4] Ross, S. and Morrison, I.D. (1988) Colloidal Systems and Interfaces, John Wiley and Sons, USA.
[5] Lyklema, J. (2000) Fundamentals of Interface and Colloid Science: Volume 1 (Fundamentals), Academic Press, UK.
[6] Derjaguin, B.V. and Landau, L. (1941) Acta Physiochim. URSS, 14, 633.
[7] Verway, E.J.W. and Overbeek, J. Th. G. (1948) Theory of the Stability of Lyophobic Colloids, Elsevier, Amsterdam.
[8] Technical Note AN160707-Concentration-Limits-Zeta-Potential-Zetasizer-Nano-EN
[11] Tucker, I.M., Corbett, J.C.W, Fatkin, J., Jack, R.O., Kaszuba, M., MacCreath, B. and McNeil-Watson, F. Laser Doppler Electrophoresis Applied to Colloids and Surfaces (2015) Current Opinion in Colloid & Interface Science 20, 215-226
[12] Patent US8702942B2 Laser Doppler Electrophoresis Using a Diffusion Barrier
[13] Application Note AN110708NovelDiffusionBarrierTechnique-EN
[14] Application Note AN120906DiffusionBarrierTechnique-EN
[15] Application Note AN140930ZPHighConductivityColloid-EN
[16] Austin, J., Fernandes, D., Ruszala, M. and Corbett, J. Routine, Ensemble Characterization of Electrophoretic Mobility in High and Saturated Ionic Dispersions (2020) Sci. Rep. 10, 4628
[17] Technical Note TN201124ZetasizerPotentialMeasurementsData-EN