
When measuring the zeta potential of biological molecules, contact with the electrodes can cause denaturation of the sample, and report an incorrect result. The diffusion barrier technique avoids contact and ensures a correct measurement is made.
A common problem associated with zeta potential measurements of small biotherapeutics such as proteins, is denaturation of the sample during the course of the measurement. This application note will demonstrate that this is due to contact of the molecules with the electrodes, and describes a novel method of avoiding this contact.
Proteins are biological macromolecules, constructed from amino acids arranged in a unique sequence, and folded into a pseudo stable structure that is sensitive to a variety of environment conditions, including pH, salt concentration & type, and temperature.
Stability of the tertiary structure is achieved through a number of energy minimizing mechanisms including:
Any disruption of the above structural properties can lead to protein denaturation. Unfortunately, the interactions of proteins with charged metal electrodes can disrupt all three of the above stabilizing mechanisms via protein adsorption, redox reactions at the di-sulfide bond, and deamidation & oxidation of surface side chain ammonium groups & histidine residues respectively.
A common symptom of protein denaturation during the course of a zeta potential measurement is a time dependent increase in hydrodynamic size, accompanied by reduction in the measured zeta potential to more negative values. While deamidation of ammonium groups and oxidation of histidine residues to aspartic acid both serve to reduce the structural stability of the protein, they also make the total charge balance of the protein more negative. So, as a general rule of thumb, one would expect a denatured protein to have a more negative zeta potential (ZP) than the native folded protein. A drift toward more negative ZP values then, is often one of the first signs of sample denaturation during an electrophoretic light scattering (ELS) measurement.
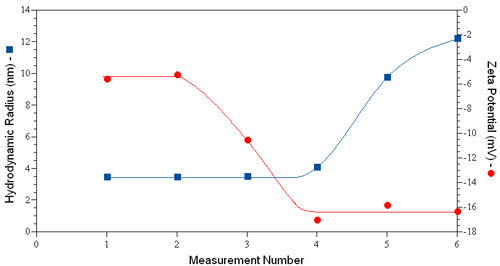
Consider for example the dynamic light scattering (DLS) and ELS results shown in Figure 1 for human serum albumin in PBS, where the hydrodynamic size was measured just prior to each ZP measurement. An increase in size is first noted in measurement #4, indicating that the 3rd ZP measurement induced a change in the size of the protein. Concurrent with the increase in size is a decrease in the measured zeta potential. If the aggregation was non-denaturing, no significant change in zeta potential would be expected, as the ZP is a function of the surface charge density, rather than the total charge. The concurrent reduction in zeta potential with aggregation then suggests the likelihood of a change in the protein's tertiary structure via sample denaturation.
|
A number of potential solutions to the ELS protein denaturation problem have been considered, such as simultaneously monitoring the size and stopping the measurements when a change is observed; using only short bursts of applied voltage to minimize the "rate" of denaturation; integrating multiple detectors, to reduce the total time that the field is applied by attempting to improve signal averaging. While all of these approaches should improve the results, they do not solve the fundamental problem, which is the interaction of the protein at the charged metal electrode. If those interactions can be minimized or even eliminated, then there is no need to put a lot of effort into attempting to minimize the consequences, e.g. aggregation, of the interaction.
Recently, scientists at Malvern Panalytical have developed a new approach, coined the "plug injection" or "diffusion barrier" technique, which isolates a small sample volume from the electrodes in a fashion similar to that utilized in CE instrumentation, where the sample is injected into a buffer stream. With regard to the challenges inherent to measuring protein zeta potential and charge, the principle benefits of the diffusion barrier technique are two fold; 1) it reduces the required sample volume to < 50 µL, and 2) it eliminates denaturation of the protein sample at the electrodes.
When performing ZP measurements with the Zetasizer Advance, the historical approach has been to:
For typical colloidal or nanoparticle type samples, this approach works well, as the 750 µl is not a significant volume. For protein samples the 750 ml volume requirement is often problematic, particularly given the propensity for sample denaturation, which makes recovery of the sample for further characterization difficult. Both of these problems can be avoided however, by isolating the sample from the electrodes, using a plug injection technique.
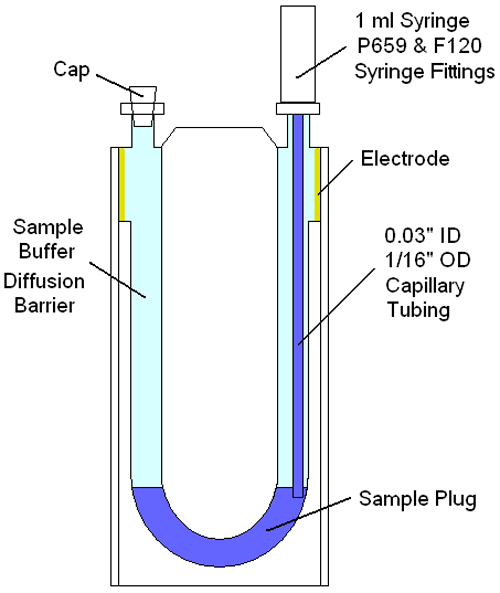
Figure 2 shows a schematic of the disposal capillary ZP cell for the Zetasizer Advance system, illustrating the components needed and approach used to inject a small (< 50 µl) plug into the measurement zone of a buffer filled cell. As noted in the schematic, the sample is isolated from the electrodes using the buffer within which the sample is prepared. Under normal temperatures & diffusion rates, the amount of time necessary for the sample to diffuse to the electrodes is measured in hours. This diffusion barrier then, allows multiple zeta potential measurements, of low volume samples, avoiding interactions with the electrodes.
|
The recommended procedures for using the diffusion barrier approach are similar to those historically used for zeta potential measurements with the Zetasizer Advance. The exception is that rather than filling the cell completely with sample, the cell is filled with the buffer within which the sample is prepared, with the sample itself being isolated in the cell measurement zone. After the sample is loaded, ZP measurements can be collected using standard methods or can be optimized using the recommendations in application note MRK1651 "The diffusion barrier technique; Practical aspects and data interpretation".
Two notes of importance here, are that the buffer used to create the diffusion barrier should be the same buffer as that used to prepare the sample, and that the temperature of the buffer diffusion barrier should be the same as that of the sample. These two points are important to minimize density & temperature gradients across the buffer/sample interface, both of which could increase dispersion of the sample through the cell by mechanisms other than simple diffusion. If these two rules are followed, the sample will remain within the measurement zone for more than enough time to complete the zeta potential measurements.
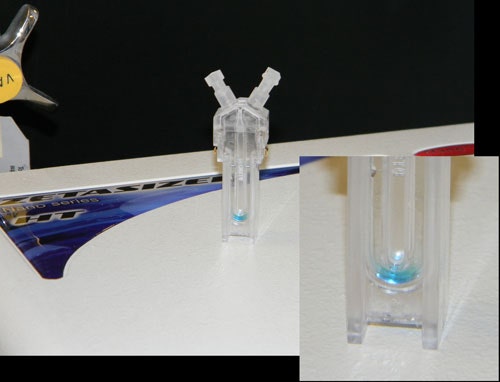
Consider, for example, Figure 3 above, which shows an image of a plug injected methylene blue in PBS, with the image taken 15 minutes after injection of the sample. As noted in this image, there is no significant dispersion of the sample into the buffer barrier, across the 15 minute time span.
|
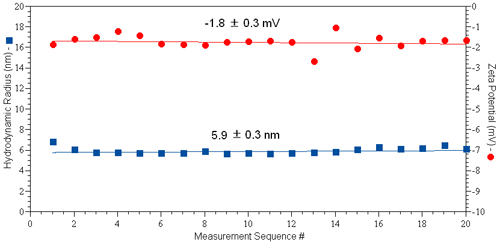
A typical set of results for protein zeta potential measurements collected using the diffusion barrier approach is shown in Figure 4, for a 50 µl sample of 10 mg/ml IgG in PBS (pH 7.4 & I = 130 mM). The Zetasizer automatic measurement mode was used. As indicated in the figure, both the hydrodynamic size and zeta potential are constant across 20 sequential size and zeta potential measurement sets.
|
These results provide clear evidence that the tertiary structure of the protein is invariant across the time span of the experiment, resulting in a marked improvement in the repeatability of the zeta potential results when using the diffusion barrier method.