A variety of aqueous (water-soluble) cellulose derivatives were characterized using the OMNISEC triple detection GPC/SEC system which revealed subtle, yet distinct differences between them. The differences described in this application note could be used in the pharmaceutical industry to correlate their
molecular properties with performance.
A key family of molecules of interest to the pharmaceutical industry is those derived from cellulose such as hydroxyethyl cellulose and others. These macromolecules are typically used as viscosity modifiers for various products such as eye drops and moisturizing creams, and as excipients in many other applications. Typical analysis of cellulose derivatives has focused on determining the molecular weight distribution and intrinsic viscosity of the sample. The main goal of this is to understand how the addition of the cellulose derivative to an existing process or solution will affect the viscosity. Miscalculating the amount of cellulose needed to modify the viscosity will either not achieve the desired increase (on the low end) or drastically increase the pumping and other processing costs (on the high end). By analyzing the cellulose before mixing into the existing solution, the user can know how much of the cellulose to add, how to blend or grade the sample, or whether to seek out another source of cellulose if the analyzed batch does not meet the user’s specifications.
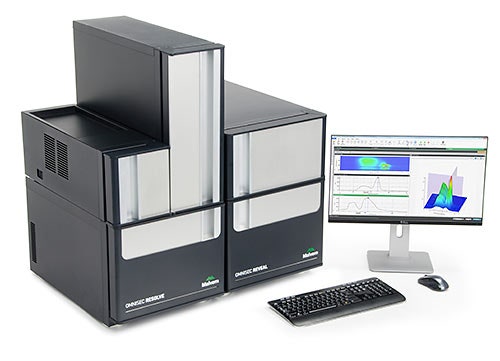
Gel permeation chromatography (GPC) or, equivalently, size-exclusion chromatography (SEC) is a widely used technique to characterize a wide variety of macromolecules, from bulk manufactured polymers to proteins. This technique can be used to measure the molecular weight moments, molecular weight distribution, the intrinsic viscosity, and/or hydrodynamic size of these macromolecules. Figure 1 shows a complete setup for a GPC system.
This application note describes the analyses of a variety of aqueous (water-soluble) cellulose derivatives using the OMNISEC triple detection system and the subtle, yet distinct differences between these different derivatives that can be parsed out by the OMNISEC system.
|
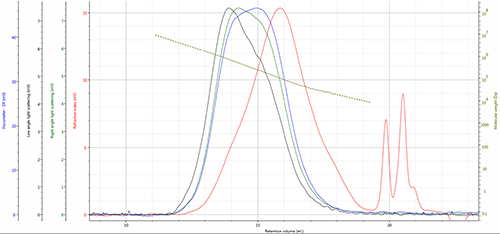
Four cellulose derivative samples were prepared for GPC analysis in an aqueous mobile phase of 0.05M Na2SO4. The samples were hydroxyethylcellulose (HEC), hydroxypropylcellulose (HPC), hydroxypropylmethylcellulose (HPMC), and hydroxybutylmethylcellulose (HBMC). Figure 2 shows a typical triple detector chromatogram using the HEC samples as an example. In this figure, the refractive index detector signal in red, the viscometer signal in blue, the right angle light scattering (RALS) signal in green, and the low angle light scattering (LALS) in black. The calculated molecular weight at each retention volume is also shown in gold to visualize the sample’s molecular weight distribution.
|
Table 1 below compares the molecular data obtained for the four cellulose derivative samples. Presented values include the moments of the molecular weight distribution (Mn, Mw, and Mz), intrinsic viscosity ([η]), and hydrodynamic radius (Rh).
| Sample | Mn (g/mol) | Mw (g/mol) | Mz (g/mol) | [η] (dL/g) | Rh (nm) |
|---|---|---|---|---|---|
| HEC | 62,600 | 223,000 | 712,000 | 3.572 | 21.00 |
| HPC | 45,600 | 69,000 | 111,000 | 1.113 | 10.21 |
| HPMC | 98,300 | 306,000 | 692,000 | 7.085 | 29.85 |
| HBMC | 102,000 | 362,000 | 831,000 | 8.556 | 33.54 |
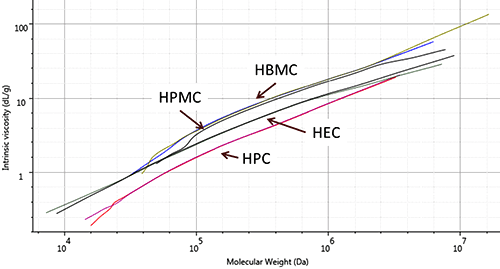
Table 1 shows that the HPC sample has the lowest [η] and the HBMC sample has the highest. Likewise, the HPC sample has the lowest Mw and the HBMC sample has the highest. This trend of increasing Mw and increasing [η] is expected and these calculations only provide average numbers regarding the samples in their entirety. A more comprehensive and detailed way of visualizing the effect of these different samples on the viscosity of a solution is to use a Mark-Houwink plot as shown in Figure 3. This plot shows the [η] of the sample at each Mw over the entire molecular weight distribution. Samples that are more tightly packed in solution are lower on the plot at a given molecular weight, while samples which are more open in solution are higher. Correspondingly, samples with a more open structure (higher on the graph) will tend to increase the viscosity of a solution more than higher density samples.
|
From inspection of Figure 3, the HPC sample is the most dense, and the HBMC sample is the least dense. We can also compare cellulose derivatives with similar structures and see that HEC is less dense than HPC, and HBMC is less dense than HPMC. At first glance this might seem counterintuitive in that the longer alkyl chain increases the density in the first comparison (HEC and HPC) and decreases it in the second (HPMC and HBMC). The most likely explanation for this is differences in the degree of substitution of methyl, ethyl, propyl, or butyl groups, which is unknown in these samples.
Here, Malvern’s OMNISEC system has been used to analyze a small selection of samples of cellulose derivatives. The differences between the samples can clearly be seen both in terms of molecular weight and molecular weight distribution and also in molecular structure in the form of a Mark-Houwink plot. The differences observed between the samples could be used in the pharmaceutical industry to correlate their molecular properties with their performance, for instance, as excipients or viscosity modifiers. In the future, characterizing such samples would enable them to be graded or blended appropriately so that the desired performance characteristics are consistently achieved.
The performance of OMNISEC in terms of its light scattering and refractive index sensitivity and its ease-of-use and robustness, with self-balancing viscometer and user exchangeable bridge makes it the premier system for making these types of measurements.