Sodium alginate, the sodium salt of alginic acid, is a polysaccharide harvested from algae, specifically brown seaweeds. Due to its similar function to cellulose in plants, sodium alginate possesses a structural integrity which results in a viscous gum that forms when it interacts with and absorbs water. Because of this, sodium alginate lends itself to applications in the food industry where it thickens solutions, dehydrates and/or expands upon the presence of water, or serves as a protective gel or coating for drug delivery. To produce these end products, manufacturers and researchers must be able to identify and relate the physical properties of sodium alginate samples with specific molecular properties, such as molecular weight, intrinsic viscosity, and molecular size, that are appropriate for each application. As such, the accurate analysis and molecular weight characterization of sodium alginate is of paramount importance.
Introduction
Sodium alginate, the sodium salt of alginic acid, is a polysaccharide harvested from algae, specifically brown seaweeds. Due to its similar function to cellulose in plants, sodium alginate possesses a structural integrity which results in a viscous gum that forms when it interacts with and absorbs water. Because of this, sodium alginate lends itself to applications in the food industry where it thickens solutions, dehydrates and/or expands upon the presence of water, or serves as a protective gel or coating for drug delivery. To produce these end products, manufacturers and researchers must be able to identify and relate the physical properties of sodium alginate samples with specific molecular properties, such as molecular weight, intrinsic viscosity, and molecular size, that are appropriate for each application. As such, the accurate analysis and molecular weight characterization of sodium alginate is of paramount importance.
Gel permeation chromatography (GPC) or, equivalently, size-exclusion chromatography (SEC) is a widely used technique to characterize a range of macromolecules, from bulk manufactured materials to natural polymers and proteins. This technique can be used to measure the molecular weight moments, molecular weight distribution, intrinsic viscosity and hydrodynamic size of these macromolecules. Figure 1 shows a complete setup of Malvern’s OMNISEC GPC/SEC system.
A brief overview of how GPC/SEC works: a solvated sample is carried by a liquid mobile phase through an analytical column full of porous gel particles, where diffusion-controlled separation of the macromolecular components occurs and is ultimately observed by different detectors as each slice of sample elutes. The sample fractions elute based on molecular size, with the larger molecules eluting first. It is important to remember that the elution order is based on molecular size and not molecular weight. A common advanced detection GPC/SEC setup, such as the one used here, includes refractive index (RI), viscometer, and light scattering detectors. The RI detector serves as the concentration detector, providing the total concentration of the sample as well as the concentration of the sample at each time increment. The light scattering detector allows the molecular weight of each data slice to be determined, independently of retention volume. The viscometer offers data regarding the sample solution’s viscosity and related molecular size information.
This application note will describe the analysis of a sodium alginate sample before and after being exposed to hydrolysis conditions for various amounts of time. Comparisons of the control and degraded products will be made, highlighting the advantages of advanced detection.
Figure 1. Malvern Panalytical’s OMNISEC Triple Detection GPC/SEC System.
GPC/SEC results
In this experiment, an unaffected Control sample, along with four batches that were exposed to hydrolysis conditions for incrementally increasing amounts of time, were prepared at concentrations of about 4 mg/mL for GPC/SEC analysis in a mobile phase of water with 0.05M Na2SO4. The samples were analyzed using 2 × A6000M columns at a flow rate of 1.0 mL/min with injection volumes of 100 µL. The triple detector chromatograms for the Control sample and sample 4, the sample hydrolyzed for the longest amount of time, are shown in Figures 2–3. The RI signal is presented in red, the viscometer signal is blue, and the right angle light scattering detector is green. The calculated molecular weight values (LogMW) are presented as a gold line; the calculated hydrodynamic radius (Rh) values are shown in dark green.
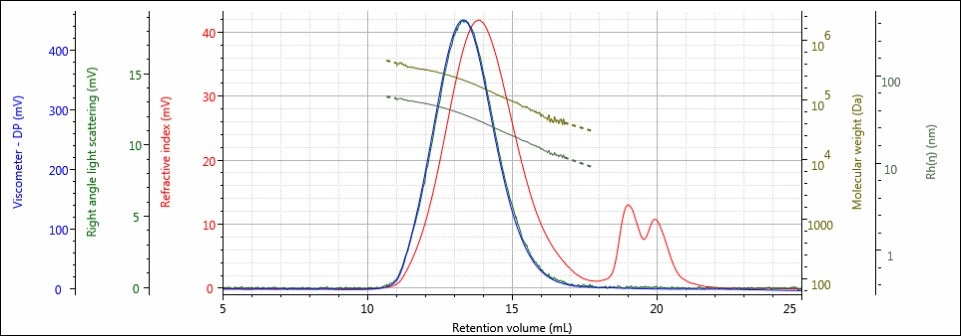
Figure 2. Triple detector chromatogram of the Control sample showing overlaid calculated values of LogMW and Rh.
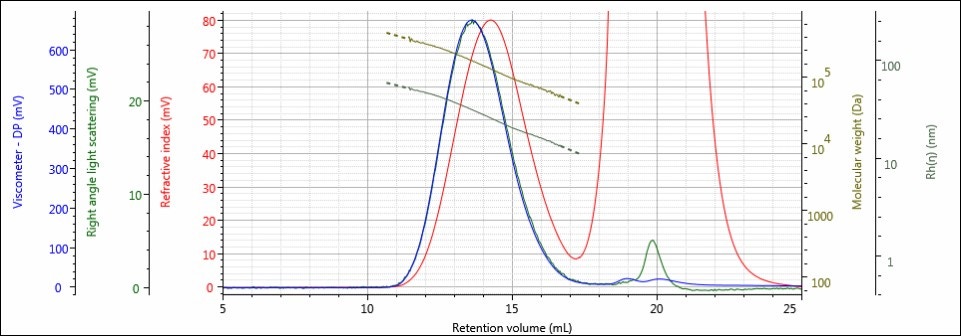
Figure 3. Triple detector chromatogram of sample 4 showing overlaid calculated values of LogMW and Rh.
The chromatography of all samples was excellent, as indicated in the figures above by the detector responses returning to baseline and the consistently decreasing LogMW and Rh plots over samples’ distribution. The large, off-scale peak in the RI detector’s response from 17-23 mL for sample 4 is a result of the hydrolysis solution. Figures 2 and 3 represent the first and last iterations of the sample; a slight shift to larger retention volumes can be observed, but it is difficult to draw more conclusions from the individual samples’ chromatograms. To make these comparisons, Figures 4-6 present the RI light scattering, and viscometer responses, respectively, for the Control sample, along with the hydrolyzed samples 1, 2, 3, and 4, with 1 being exposed to hydrolysis the least amount of time, and 4 being exposed the most.
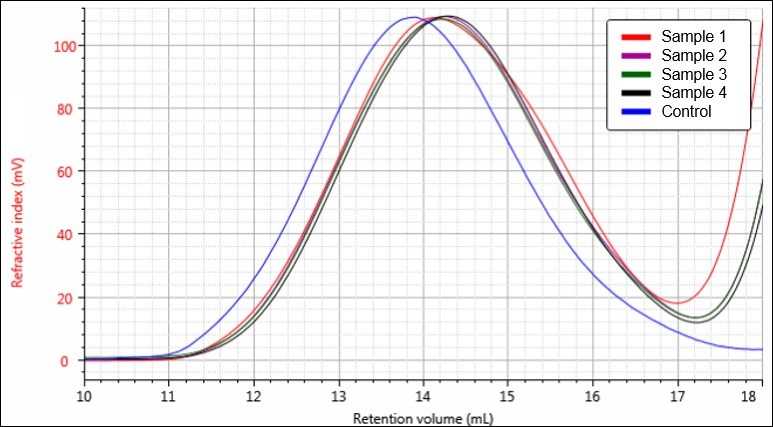
Figure 4. Overlay of RI chromatograms for samples Control (blue), 1 (red), 2 (purple), 3 (green), and 4 (black).
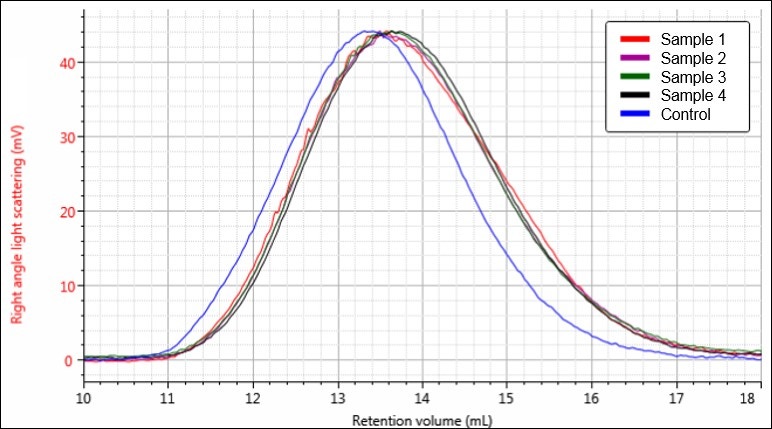
Figure 5. Overlay of light scattering chromatograms for samples Control (blue), 1 (red), 2 (purple), 3 (green), and 4 (black).
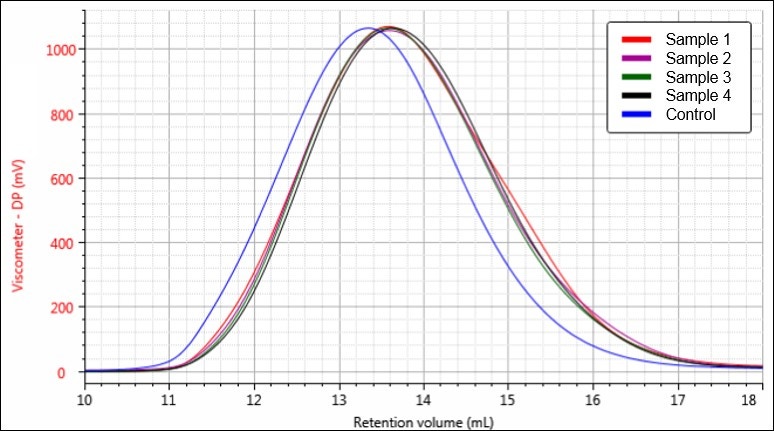
Figure 6. Overlay of viscometer chromatograms for samples Control (blue), 1 (red), 2 (purple), 3 (green), and 4 (black).
Figures 4-6 each display a trend of increasing retention volume from samples Control through 4, which would correspond with a decrease in molecular size, and potentially molecular weight, as the hydrolysis procedure progresses. The largest difference appears to be between the Control sample and the first hydrolysis product, followed by smaller shifts through samples 2, 3, and 4.
Calculated molecular data
To confirm the visually observed trends present from samples Control through 4, the molecular weight moments (Mw, Mn), intrinsic viscosity (IV), and Rh values were calculated for each sample. The dn/dc, or refractive index increment used for the analysis was 0.150, typical of polysaccharides in aqueous media. The results displayed below in Table 1 represent the average of multiple injections of each sample.
Table 1. Calculated molecular characterization data for samples Control, 1, 2, 3, and 4; Mw & Mn in Da.
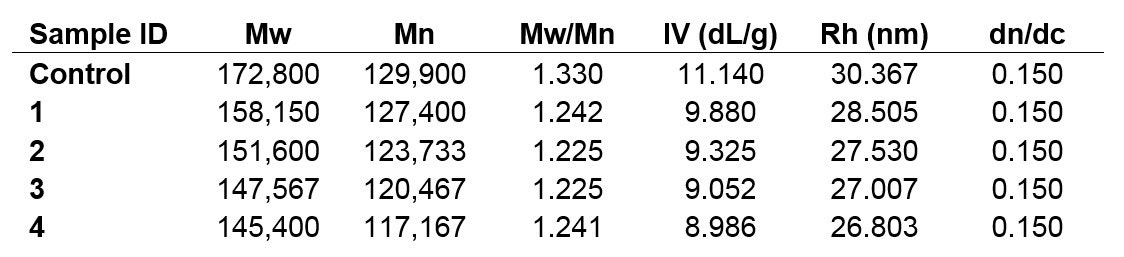
The decreasing trend apparent from the chromatograms is reflected and confirmed in the calculated numerical data. The Control sample possesses the highest molecular weight, IV, and Rh values, and those parameters all decline from one sample to the next. This is not surprising, considering the goal of hydrolyzing a sample, but the observation of steady sample degradation allows the process to be monitored and controlled to reach target molecules.
Mark-Houwink-Sakurada data
The chromatographic data indicates the sample is getting progressively smaller as the hydrolysis process continues. The numerical data confirms the sample is getting smaller and quantifies how the molecular weight, IV, and Rh values are changing. None of that information, however, specifies what is happening to the molecular structure as it degrades.
To reduce a sample’s molecular weight, it stands to reason that some of the molecular bonds within the sample must be broken. If these bonds to be broken reside in the main backbone of the material, the overall molecular structure will remain consistent but will now exist as a chain of shorter length than the original material. If the bonds to be broken are part of a pendant or side chain functionality, then the molecular structure, molecular weight and other parameters will change, but the length of the molecular chain will not. This is exemplified by the production of polyvinyl alcohol from the hydrolysis of polyvinylacetate, where the side chain changes but the degree of polymerization does not.
To determine which type of sample degradation is occurring with the sodium alginate samples, an investigation into the structure of the samples was required. The best way to do this was through the Mark-Houwink-Sakurada plot, in which the IV is displayed as a function of molecular weight. Polymers with consistent structures throughout their molecular weight range have MHS plots that appear as straight lines, and samples with similar structures will have MHS plots that overlay. Samples with different molecular densities, as a result of differences in structure, will appear “stacked,” with the densest material situated lowest in the plot (as molecular density is inversely related to IV).
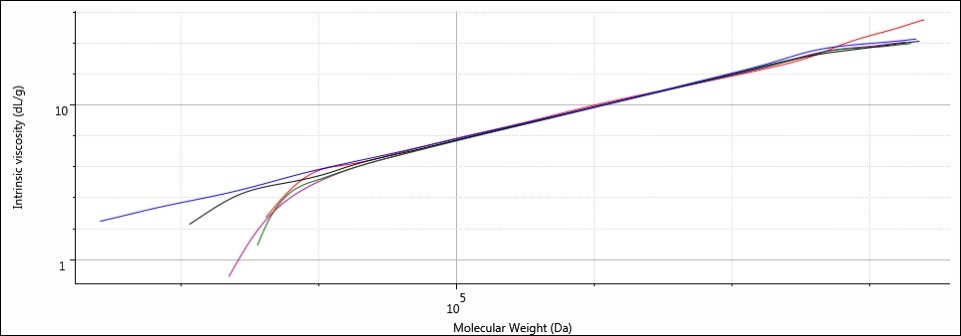
Figure 7. Overlay of MHS plots for samples Control (blue), 1 (red), 2 (purple), 3 (green), and 4 (black).
The plots for all five samples are linear, and they also coincide with one another along the same trajectory. This indicates that although the molecular weight range may differ between samples, the relationship between IV and molecular weight remains constant. This supports the notion that the molecular structures between all samples are identical and the molecular weight and size difference is a function of shorter chain lengths resulting from hydrolysis of bonds situated in the main backbone of the sodium alginate.
Conclusions
Through the triple detector chromatograms, the calculated numerical data, and structural analysis via the MHS plots, the data presented above details the level of degradation of the sodium alginate sample at various stages of hydrolysis. Over time, the sodium alginate sample was found to decrease in molecular weight, IV and Rh, yet its molecular structure remained consistent. This type of thorough evaluation, especially the structural analysis, was made possible using a GPC/SEC instrument equipped with advanced detectors.
The ability to accurately determine and study the molecular weight, IV, Rh, and molecular structure of samples such as sodium alginate is critical to supply researchers and manufacturers with the information needed to develop and produce specific products for sophisticated applications. Since the bulk properties of a sample are greatly influenced by its molecular weight, control of the hydrolysis process can result in finely-tailored materials, without compromising the molecular structure. Additionally, the gradual degradation process offers information into how this material may behave in similar biological conditions. This detailed insight can contribute to the creation of advanced and novel materials in food, pharmaceuticals, consumer products and any other industries where these products are used.