According to FDA definition, a generic drug is "a drug product which is comparable to a reference listed drug (RLD) product in dosage form, strength, route of administration, quality, performance characteristics, and intended use" [1]. Rigorous rules and regulations pertaining to abbreviated new drug application (ANDA) submissions are complex and the generic drug industry strives to meet these in their efforts to obtain approval for a product. Generics companies must be highly skilled and disciplined in product development and critically, establishing bioequivalence, to have a chance of being first to file.
In this application note we discuss the use of Malvern Panalytical’s Morphologi® 4-ID and Morphologically-Directed Raman Spectroscopy (MDRS®), a physicochemical technique which is rapidly gaining acceptance for application in bioequivalence studies. Using MDRS, two orally-administered cold and ‘flu remedies were analyzed and compared. One of the products was the RLD, and the other a generic (test) version of the product. Both products are licensed from the same Marketing Authorization holder, so although they are packaged and priced differently, the two formulations should be comparable.
The particle size and shape distributions and the overall compositions of the two products were compared. Then, further comparison was made between the individual components within the two formulations.
The two samples were dry powder formulations (held within sachets) that were automatically dispersed and analyzed using MDRS on the Morphologi 4-ID. A sample volume of 5 mm3 was dispersed using the integrated Sample Dispersion Unit (SDU) using the low energy setting. Each sample was measured in triplicate using 5× magnification and the Sharp Edge segmentation method. For each replicate, 500 particles with a circular equivalent (CE) diameter greater than 20 µm were targeted for Raman chemical identification with a spectral acquisition time of 30 seconds at 100% laser power.
A reference library was created from spectra for eight known components, including three Active Pharmaceutical Ingredients (APIs): paracetamol (acetaminophen), phenylephrine and guaifenesin (Figure 1). During the analysis, every particle spectrum was compared to the library, and particle classifications were set according to a score of the correlation between the collected particle spectra and the respective library spectra. Correlation is scored from 0 to 1, where 0 indicates no correlation and therefore the sample particle is a different chemical to the reference, and 1 indicates a perfect correlation and therefore the particle is the same chemical. Typically, a threshold value is set at a position where the user has confidence that chemical components can be differentiated.
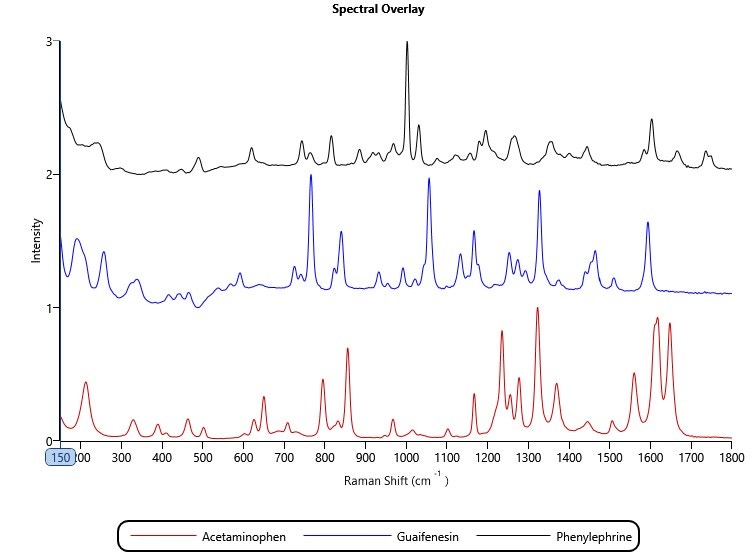
Figure 1: Raman spectra of the three APIs: paracetamol (acetaminophen), phenylephrine and guaifenesin
To demonstrate bioequivalence, the test product must be shown to be quantitatively and qualitatively the same as the RLD. Because the products tested here are immediate-release dosage forms with systemic action, in vitro dissolution profiles that are comparable to those of the reference product (f2-test) may support bioequivalence, and under certain circumstances may be used to help waive the requirement for further in vivo studies [2]. Particle size and shape are used to control the dissolution rate; therefore, the particle size and shape distributions of the test product must be equivalent to those of the RLD.
In order to quickly compare the 6 datasets (2 samples measured in triplicate) for the full formulations – including excipients - for variability across all of the the size and shape distributions, the Morphologi 4’s Parameter Variability Chart was used (Figure 2). A summary of the 6 results in terms of the mean value for 6 of the size and shape parameters measured (by number) is shown in Table 1, and variability across all measured parameters is also shown in the chart below. The length of the bars is proportional to the variability between the datasets for that parameter. Since the bars are short, we can see that there is low variability, and therefore high similarity, across these datasets, which is in agreement with the results in the table and the overlaid size and shape distributions.
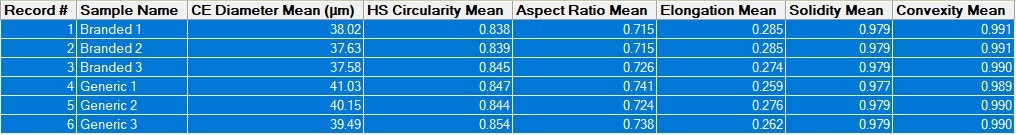
Table 1: Summary of mean measurements of size and shape for six datasets (2 formulations measured in triplicate)
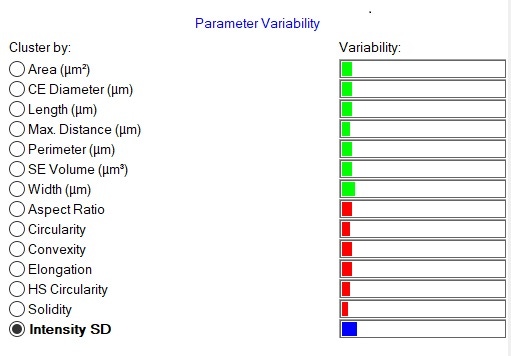
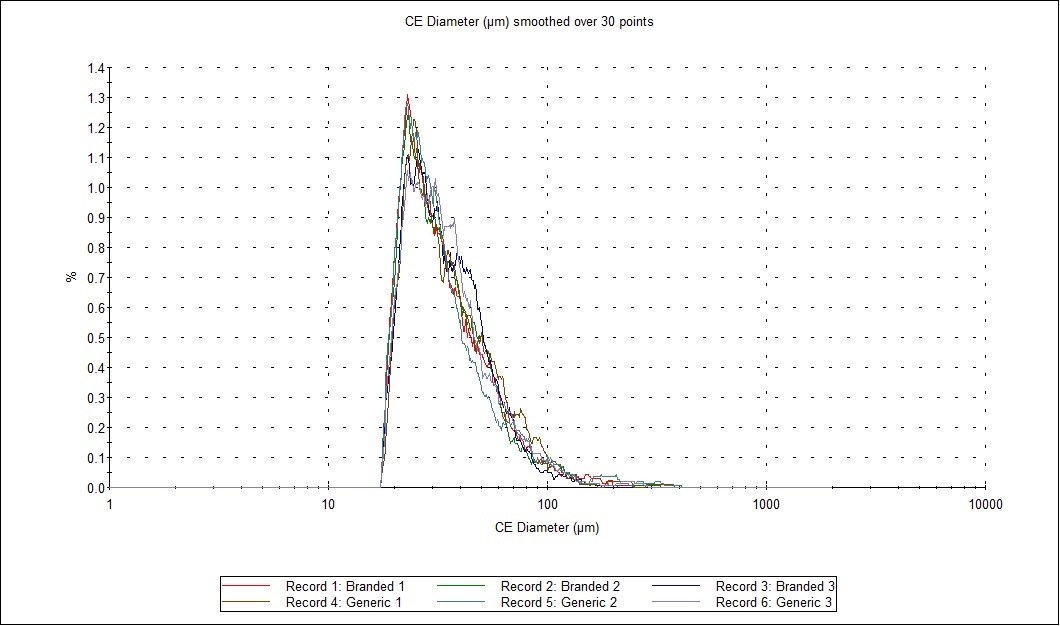
Figure 2: Comparison of size and shape parameters between the six datasets (2 samples measured in triplicate). The Parameter Variability chart (A) depicts the variability of fourteen parameters between the six records selected in the table above. Green bars show size parameters, red bars show shape parameters and the blue bar is related to light transmission. The overlaid distribution profiles (B) show high similarities of the CE diameter of the particles.
Figure 3 shows the Classification Chart comparing the 6 results (2 samples measured in triplicate). Here, the particles in each classification are counted and displayed as a percentage of the total number of measured particles, to give a representative composition for each sample. Comparing the results, some minor variation between replicates is shown, but there are no clear differences between the two formulations, as might be expected.
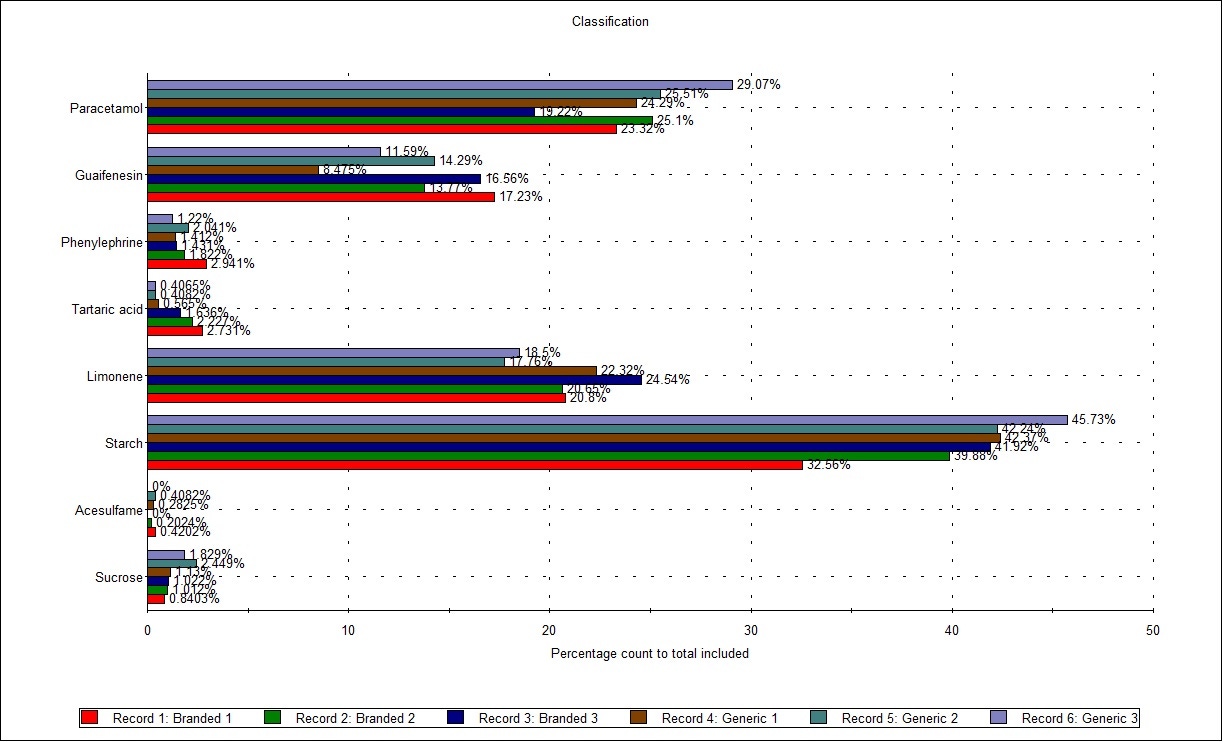
Figure 3: Classification Chart showing the composition by count of all components of the 2 samples tested (in triplicate)
The information shown in Figures 2 and 3 is useful for qualitative and quantitative analysis of the products. But it may not give a full picture of the performance of each component in some pharmaceutical products – this is something MDRS is able to help with, by enabling individual components to be compared.
Figure 4 presents an overlay of the CE Diameter, and arithmetic (by number) particle size distributions from the most abundant API (paracetamol) from each replicate. The observed overlays and statistical analysis show a high level of similarity for paracetamol in both formulations.
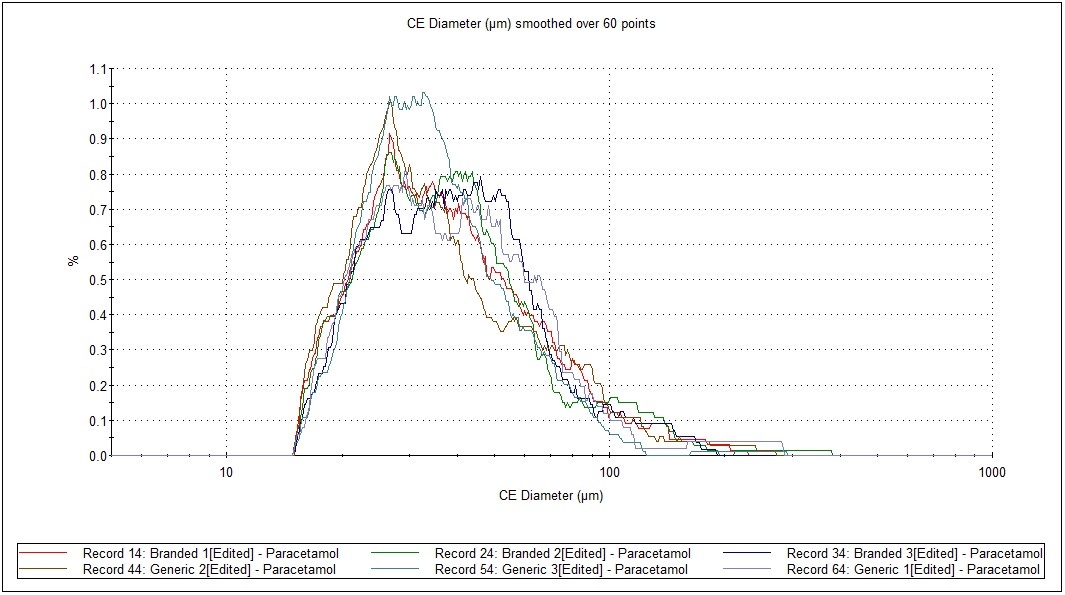
Figure 4: Particle size distribution by number, in test and RLD formulations of a cold and ‘flu remedy
Morphological results for the 3 most abundant components of both formulations - two APIs, paracetamol and guaifenesin, and the excipient starch - were compared in terms of their size and shape distributions using the Parameter Variability Chart (Figure 5). The parameters with the greatest variability across all datasets were Aspect Ratio (width/length), Elongation (1-width/length) and Circularity. To further understand the differences between the components, the Morphologi Dendrogram (Figure 6) was used, which groups or separates datasets according to the similarities/differences in the distributions of a selected parameter - Aspect Ratio, in this example. Using this parameter, paracetamol, guaifenesin and starch were separated into distinct groups and within each of these groups, the generic and reference product results were found to be similar. This indicates that Aspect Ratio can be used to differentiate between these three chemical components, although paracetamol and starch differed from each other to a lesser extent when compared to guaifenesin. Circularity and Elongation were also found to differentiate between the three components in a similar way.
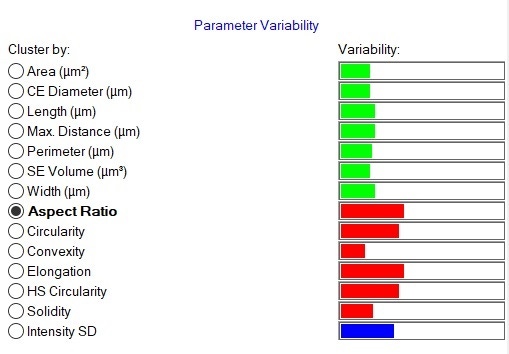
Figure 5: Parameter variability table. Green bars show size parameters, red bars show shape parameters and the blue bar is related to light transmission
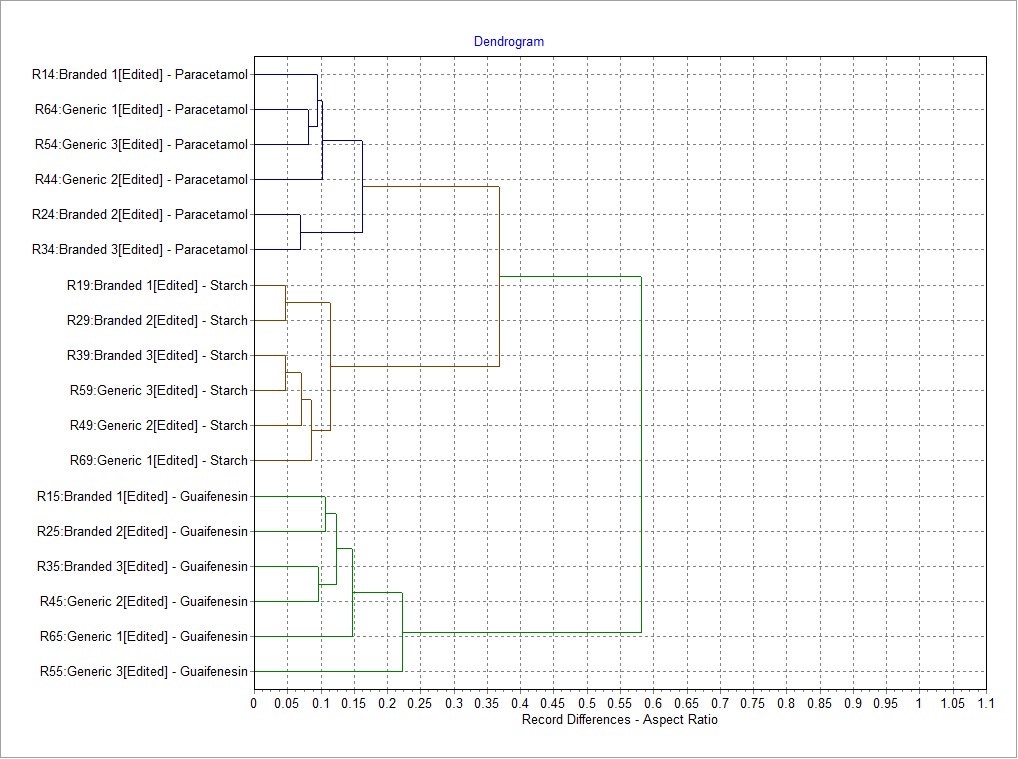
Figure 6: The Morphologi dendrogram showing the differences between each record for a particular parameter (Aspect Ratio in this case) and how the datasets are grouped.
The Trend Plot (Figure 7) shows how the mean value of a selected morphological parameter changes between the components of the samples. Aspect Ratio is highest for starch (brown), then paracetamol (blue), and is lowest for guaifenesin (green). A low Aspect Ratio value relates to a more needle-like shape. This data agrees with the appearance of the particle images, where guaifenesin appears needle-like, paracetamol appears irregular and slightly elongated, and starch appears irregular and circular.
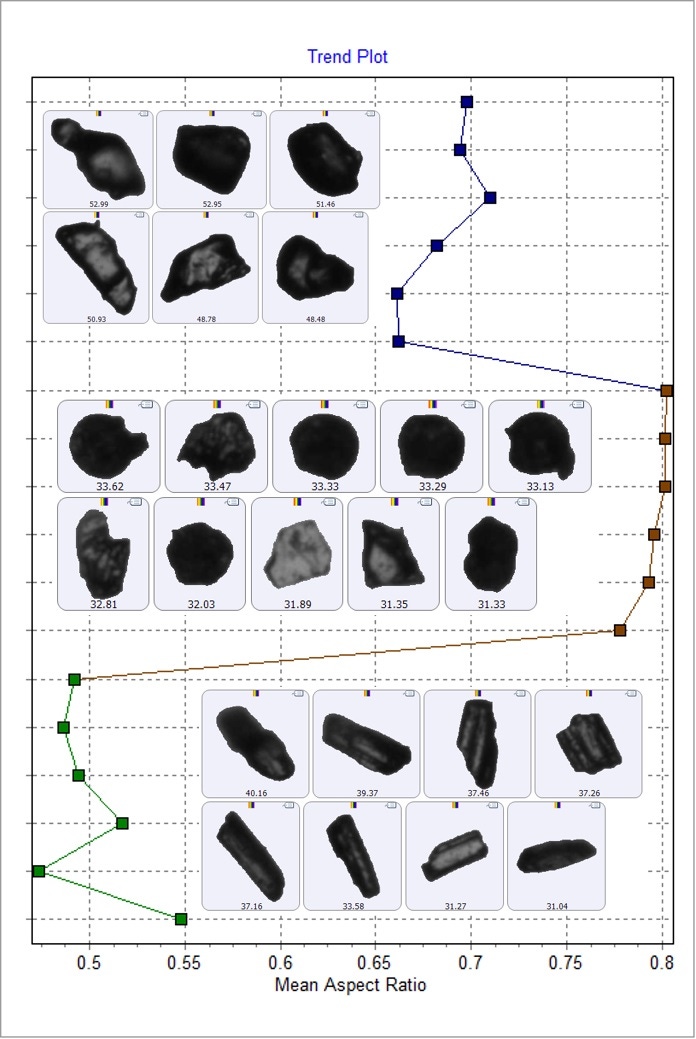
Figure 7: Trend plot showing how the Aspect Ratio parameter changes between the components. Blue data points (top) are paracetamol, brown data points (middle) are starch and green data points (bottom) are guaifenesin
Based on the similarity in composition of the two samples shown in the Classification Chart (Figure 3), the high similarity of the overlays of the particle size distributions of one component (paracetamol, Figure 4) and the low variability between the samples (all components considered) seen in the Parameter Variability chart (Figure 2), it can be concluded that the two samples are pharmaceutically equivalent in terms of the properties measured.
When comparing the size and shape distributions of the other components between the six datasets, a high level of similarity was also observed (data not shown).
This data shows how MDRS may be used to demonstrate pharmaceutical equivalence, which plays an important role in the exploration and establishment of bioequivalence. MDRS is also applicable to deformulation or root cause analysis studies, where component-specific particle size and shape provide vital information on process and product quality and changes.
References
Accessed 16.10.2018
2. Guideline On The Investigation Of Bioequivalence, EMEA, CPMP/EWP/QWP/1401/98 Rev. 1
3. R-K. Chang, A. Raw, R. Lionberger, L. Yu, Generic Development of Topical Dermatologic Products: Formulation Development, Process Development, and Testing of Topical Dermatologic Products, AAPS, 15, 1, 2013