The sub-nanometre sizing capability of the Zetasizer Nano was tested using the measurement of sucrose, which was chosen because of its availability in a pure form, and the known structure which could be used to model the hydrodynamic diameter.
Dynamic light scattering (DLS) is a non-invasive technique for measuring the size of nanoparticles in a dispersion. The technique measures the time-dependent fluctuations in the intensity of scattered light from a suspension of particles undergoing random, Brownian motion. Analysis of these intensity fluctuations allows for the determination of the diffusion coefficients, which in turn yield the particle size through the Stokes- Einstein equation [1-3].
The lower size limit of the DLS technique depends on the amount of excess scattered light produced. This excess is the difference in scattering between the molecule or particle being studied and the dispersant it is prepared in. This in turn depends on a number of factors such as the refractive indices of the molecule and dispersant, the concentration of the sample, the power and wavelength of the laser used, the sensitivity of the detector and the optical configuration of the instrument.
An optical configuration that allows measurements of samples at lower concentrations of smaller sizes is backscatter detection. At 173° backscatter, the scattering volume observed at the detector is about 8 times the volume observed with classical 90 degree scattering optics. This results in an 8 fold increase in the detected count rate, which is directly correlated with instrument sensitivity, or the ability to measure small particles at lower concentrations. The use of fiber optics in combination with this optical arrangement ensures that the signal to background ratio, or more correctly, the intercept of the correlation function, is not degraded at high detection volumes as it would with 'classical' geometric optics [4].
Probing the ultimate capabilities of a DLS system in terms of both the size and concentration that can be measured poses some issues with regard to experimental technique and the samples that may be used as test materials. At sizes above 20nm, monodisperse, traceable latex standards are available. For sizes below 10 nm, proteins are often used, although preparation of a sample of the monomer is not straightforward. For a sample close to or below 1nm in size, something other than a protein must be considered. Suitable nanoparticle samples are difficult to obtain in a well dispersed state containing no aggregates.
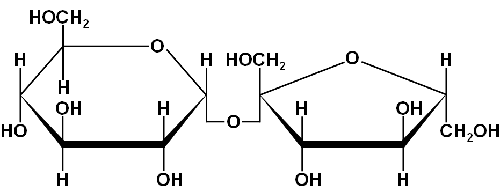
An ideal candidate as a test material to test the performance of a light scattering system is sucrose. It is easily obtained, available in a crystalline, pure form and readily dissolves in water. A sucrose molecule consists of a glucose and fructose molecule joined through ana-glycosidic linkage [5] (figure 1).
|
This application note explores the lower limits of size which are measurable by dynamic light scattering using sucrose as a test sample.
Various sucrose solutions (5 to 35% w/v) were prepared in ultra pure water and filtered through Whatman Anotop 0.02µm pore size filters (cat. no. 6809-3002).
Measurements of all sucrose concentrations were made on a Malvern Zetasizer Nano S (Malvern Instruments Ltd., UK) with a detection angle of 173°. All measurements in this study were taken at a temperature of 25°C. At least 3 repeat measurements on each sample were taken to check for result repeatability. The Nano S uses a 4mWHe-Ne laser operating at a wavelength of 633nm. The intensity size distributions were obtained from analysis of the correlation functions using the Multiple Narrow Modes algorithm in the instrument software. This algorithm is based upon a non-negative least squares fit [6, 7]. These intensity particle size distributions were converted into volume using Mie theory [8]. The optical properties of the sucrose molecules were not considered important because their size is significantly lower than the incident laser wavelength used.
The technique of DLS measures the diffusion coefficients of molecules or particles undergoing Brownian motion. To convert the measured diffusion coefficient data into a hydrodynamic size, the viscosity of the sample must be entered into Stokes-Einstein's equation. There are a number of ways of determining what the correct viscosity value for the samples that should be used. However, because the technique of dynamic light scattering measures the diffusion speed of molecules or particles undergoing Brownian motion, a useful method of determining the appropriate viscosity value is to dope each sucrose sample with a known size of polystyrene latex standard. In this study, 10µl of a 150nm polystyrene latex (cat. no. 3150A) obtained from Duke Scientific (Palo Alto, US), now Thermo scientific, Fremont CA, was added to 990µl of the appropriate sample. Comparison of the size obtained for the latex dispersed in sucrose (assuming the viscosity of water) with the size obtained for the same latex dispersed in 10mM NaCl (the true hydrodynamic diameter), allows for the determination of the viscosities of the sucrose solutions. Measurements were made in 10mM NaCl in order to suppress the electrical double layer according to the International Standard ISO22412 [3]. This method of adding latex to the sucrose solutions works well, as the scattering from the larger latex particles is much greater than that from the sucrose molecules.
The viscosity required for DLS measurements is the viscosity that the particle being studied experiences as it undergoes Brownian motion. The viscosities of the sucrose solutions were determined by the method discussed above.
This is the most appropriate way of obtaining this information and is a valid technique as long as the latex being used is not being affected by the dispersant it is doped into and as long as the introduction of latex does not significantly alter the sample viscosity. In this study, such a small aliquot addition to each sucrose concentration would not be expected to affect the viscosity of the solutions.
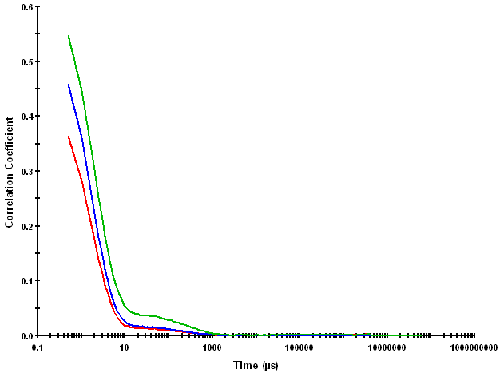
Figure 2 shows some typical correlation functions obtained from measurements performed on some of the sucrose solutions on a Zetasizer Nano S using backscatter detection. The figure shows the data obtained for three lowest sucrose concentrations (5, 10 and 15% w/v respectively) as these would be expected to give the lowest excess scattering. The intercept of the correlation function (i.e. the intercept of the Y axis obtained by extrapolating the correlation coefficients to zero time) is the signal to noise ratio obtained for the measurement.
|
Values of less than 0.1 indicate poor data quality. However, even the 5% sucrose concentration gave an intercept of around 0.5 and so the intercepts obtained for all samples in this study gave excellent values.
The correlation functions shown in figure 2 exhibit two visible decay rates. The rapid decay rates seen in delay times up to 10 microseconds are interpreted as arising from the diffusion of sucrose molecules. The slower decay rates seen near to the baseline of the correlation functions (at correlator delay times of between 10 and 1000 microseconds respectively) are probably due to collective diffusion of the sucrose molecules. This hypothesis is supported by the increase in amplitude of this slow decay rate with increasing sucrose concentration.
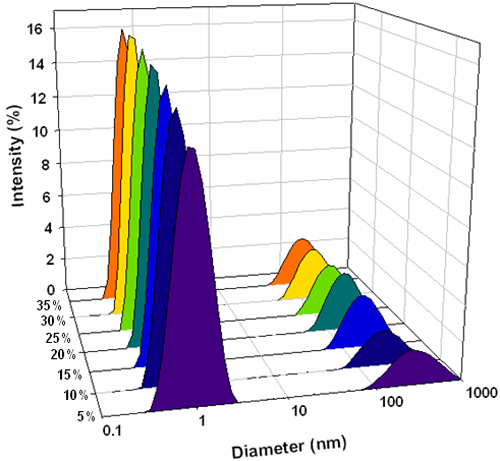
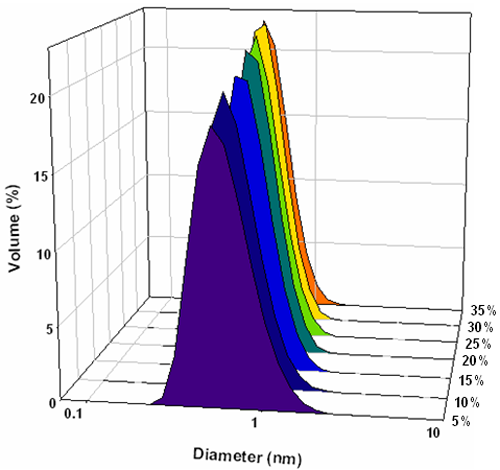
The intensity particle size distributions obtained from the analysis of these correlation functions are shown in figure 3. Each concentration gives a bimodal distribution with the main peak mode consistently around 1nm diameter and a second peak mode around 200nm. Conversions of the measured intensity size distributions into volume distributions were done using Mie theory [8] and the volume size distributions obtained are shown in figure 4. These all consist of monomodal distributions with peak modes consistently less than 1nm.
|
|
The results from this study indicate that the measurement of sub nanometer sizes are now possible using dynamic light scattering if samples are carefully prepared and an appropriate optical configuration is used. The use of backscatter detection in combination with fiber optics provides exceptional sensitivity with retention in the signal to noise sufficient to be able to measure samples at these small sizes.
[1] Dahneke BE (1983), Measurement of suspended particles by quasi-elastic light scattering. Wiley, New York.
[2] Pecora R (1985) Dynamic light scattering: Applications of photon correlation spectroscopy. Plenum Press, New York.
[3] International Organization for Standardization, International Standard ISO22412:2008, Particle size analysis, Dynamic Light Scattering (DLS)
[4] Peters R (2000) Fibre optic device for detecting the scattered light of fluorescent light from a suspension. US Patent 6,016,195.
[5] Stryer L (2002) Biochemistry. W.H. Freeman, New York.
[6] Twomey S (1997) Introduction to the mathematics of inversion of remote sensing and indirect measurements. Dover Publications, New York.
[7] Lawson CL and Hanson RJ (1995), Solving least squares problems. Society for industrial and applied mathematics (SIAM), Philadelphia.
[8] Mie G (1908) Beiträge zur optik trüber medien, speziell kollodaler metallösungen. Ann. Physik, 4: 377-445.