Setting meaningful and realistic product specifications is essential in the application of Quality by Design during pharmaceutical development. Here we consider the process of selecting specifications, using particle size as an example parameter.
Setting meaningful and realistic specifications is an essential element of Quality by Design (QbD). Well-defined specifications control product performance since they derive from correlations between clinical behaviour and the variables measured routinely during processing and for QC. This paper examines the process of setting specifications, taking as an example particle size, a critically important parameter for many pharmaceutical formulations.
Multiple pressures on the pharmaceutical industry and the regulatory bodies that control it are driving the shift towards a risk-based approach to production. Increasingly regulators are focusing scarce resource on those less well-understood products and processes with significant potential for harm, responding more flexibly to manufacturers who can demonstrate sound understanding and control. Quality by Design (QbD) is a key part of this change in emphasis, promoting development of the knowledge through which manufacturers will prove competence.
Setting appropriate product and processing specifications is fundamental to QbD. Clinical performance is a function of key variables controlled by and during the manufacturing process. Identifying these Critical Quality Attributes (CQAs) and controlling them within clearly defined ranges delivers acceptable product quality and the required in vivo behaviour. Getting specifications right is therefore essential, but demanding. An overly tight specification will make manufacturing more difficult than it needs to be, compromising production economics, yet one that is too loose may result in product inconsistencies that impact efficacy.
Here we consider the process of specification setting in some detail, using particle size as an example parameter. Particle size influences the key performance characteristics of many of the suspensions, inhaled powders and tablets widely used in drug delivery.
FDA guidance enshrined in ICH topic Q6A states that 'specifications are critical quality standards that are proposed and justified by the manufacturer and approved by regulatory authorities as conditions of approval.' Because specifications define product acceptability the need for one is based on the existence of a link between a variable and some aspect of performance. Within the framework of QbD such correlations establish a parameter as a CQA, the control of which assures product quality. The regulatory guidance suggests these might include:
Clearly if a variable has no influence on product quality there is no need to specify values for it, but equally, where there is a correlation any associated specification must provide adequate control. The best way to define the specification will depend on the mechanism by which the variable influences behaviour; optimal definition requires detailed understanding. QbD emphasises the need for relevant information at the early stages of a project, and the importance of developing an adequate knowledge base. The pharmacopoeial standards, development data, test data from pre-clinical and clinical studies, and from stability trials are all good sources of information.
ICH topic Q6A contains a decision tree that determines the need for a particle size specification, recommending them for both solid dosage forms and liquids containing undissolved drug (suspensions) when particle size is critical to any of the following:
The dependence of dissolution behaviour on particle size, or more accurately surface area, is widely recognized. For solid dosage forms dissolution behaviour, including overall solubility, influences in vivo release and is often tightly controlled to obtain the required delivery profile. Finer powders dissolve more rapidly, and those with a narrow size distribution all dissolve at a similar rate, which may or may not be the design intent. For OINDPs (orally inhaled and nasal drug products) the link with bioavailability is even more direct, because incorrectly sized particles will not deposit within the desired part of the respiratory system, thus failing to enter the body by the prescribed route.
Processability is important because it tends to correlate with product consistency and quality, with erratic or poorly controlled processes producing a low quality output. The aim of QbD is to develop a manufacturing process on the basis of sound science that will deliver long-term optimal manufacture, reducing the reliance on final QC testing. Particle size relates to parameters such as powder flowability, segregation behaviour and, in the case of tableting processes, compressibility. As such, well-defined size specifications for in-process material or intermediates may provide a means of reducing process variability.
Stability issues arise because the forces acting on particles are a function of their size. Smaller particles are more likely to cluster or agglomerate because inter-particle forces are relatively high, while with suspensions the propensity to settle increases with size because of the effects of gravitational forces. If settling does occur then the chances of consistent dosing are reduced, unless the active ingredient is successfully re-suspended before use. Stability must be considered during the development of particle size measurement methods, to ensure that the state of dispersion during analysis reflects that of the material.
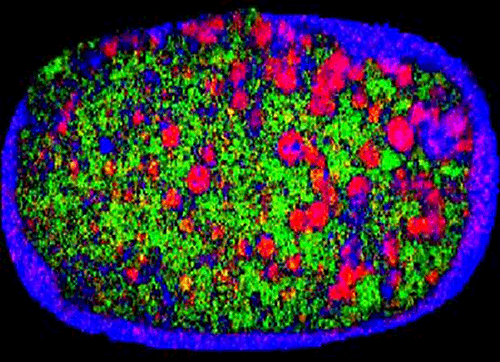
Finally, particle size can influence blend uniformity and, as a result, the dose content uniformity associated with a product. For example, Figure 1 shows a near-infrared chemical image of a recalled tablet with the active ingredient-rich domains picked out in red. These areas are much larger on the right side of the tablet than the left, showing that composition is not uniform. The reason given for the recall of these tablets was that 'due to larger particle size some of the unit doses may not meet potency specifications'. Here then is a direct example of poor particle size control resulting in a sub-standard product. Development of a particle size specification may provide a means of control.
|
In summary then, particle size specifications are often required for solid dosage forms or suspensions because particle size influences so many aspects of product performance. Correlations with, for example, dissolution profile, content uniformity, suspension stability, and/or mouth feel, form the basis for specification development.
Before considering how a particle size specification can be set, it is worth reviewing the methods by which particle size analysis can be carried out. There are now a range of particle size analysis tools which are available to support pharmaceutical development. Selection of the most appropriate technique is, in itself, an important consideration, with parameters such as the precision and accuracy of measurement, the time for analysis, ease of method development and transfer, and system cost being possible selection criteria.
One of the most widely used techniques for particle size analysis within the pharmaceutical industry is laser diffraction. Laser diffraction is a particle size measurement technique with broad applicability, suitable for both wet and dry systems with particles in the size range 0.1 to 3500 microns. A particularly attractive feature of the method is that it is an ideal Process Analytical Technology (PAT) so specifications developed in the laboratory, can, if the right equipment is used, be transferred into production.
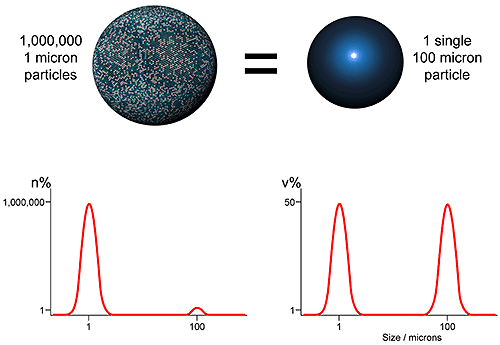
Using laser diffraction as an example, the first issue which should be understood in setting a specification relates to how the particle size distribution is represented. As an ensemble sizing method, laser diffraction produces volume based distributions. This means that data are generated simultaneously for the whole sample (ensemble) rather than for individual particles, and are presented in terms of the volume of material in a given size fraction. An alternative, used by imaging and microscopy methods for example, is to display data on a number basis i.e. show the number of particles in each size fraction. Both approaches are equally valid, but the results produced are very different (see figure 2)
|
The number and volume distributions shown in figure 4, clearly an extreme case, reflect different attributes of the sample. The volume distribution highlights those size fractions in which most of the mass or volume lies, while the number distribution captures the presence of fines. Which is the better measure depends on the application. Comparisons of number and volume-based distributions are feasible but best avoided if possible, because of the impact of measurement errors. A better approach is to consider this issue during analytical technique selection.
Although the measurement of particle size distributions is extremely useful, specifications are seldom based on the entire distribution, but instead normally consider specific distribution parameters or statistics. Choosing the most relevant parameter and making a judgement as to whether a single figure is adequate or whether multiple descriptors of distribution are necessary, are important steps in the specification setting process.
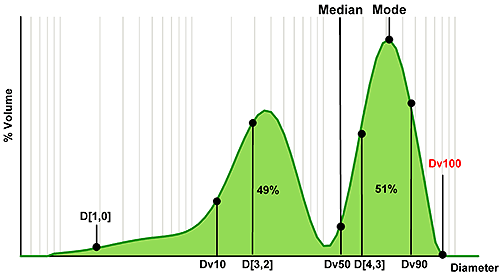
Figure 3 shows an example size distribution, in this case a mixture of two components, which has been measured using laser diffraction. Using this, we can consider which statistics relate to different regions of the distribution.
|
The median is the particle size in the middle of the distribution. In the case of laser diffraction, this is referred to as the Dv50, indicating that 50% of the volume of particles are larger and 50% smaller than this value (the notation 'v' shows that this parameter relates to a volume distribution). For the single Gaussian distribution, median and mode (the most common particle size) are identical; however for the bimodal distribution such as the one shown here the mode reveals nothing about the smaller peak. The median value on the other hand does reflect the presence of fines and is located between the two populations.
A similar notation can be used to describe other points within the size distribution. So, the Dv10 relates to the particle size below which 10% of the volume of material exists, and is therefore positioned towards the fine end of the distribution. In contrast, the Dv90 is associated with the coarse end of the distribution. The Dv100 is also shown, and might seem a logical choice if the aim is to avoid particles above a certain size. However, using Dv100 makes the analysis sensitive to the presence of just one large particle, massively increasing the importance of representative sampling. With modern instrumentation sampling is often the largest source of error so this approach is not recommended. Using Dv90 or even Dv95 can provide a more robust parameter for assessing the coarse fraction.
The other term commonly used for the description of statistical data is mean or average. However, in selecting a mean size parameter, it is important to understand how the mean is calculated. The mean may be 'weighted' according to different particle parameters. Typical parameters include the number or arithmetic mean diameter, the D[1,0], surface area moment mean, the D[3,2], or volume moment mean, the D[4,3]. Clearly the different weightings for each of these means will yield different results, as shown in figure 3.
The moment means are more commonly used for specifications: the D[3,2] shows a greater sensitivity to fines content, as the fine particles have a high specific surface area, whereas the D[4,3] is particularly useful for the detection of larger particles, as these contain the greatest volume of material. Where the mean is the basis for a specification then selecting an appropriately sensitive measure is therefore essential (see box).
Consider a particle population consisting of ten particles of unit diameter and one with a diameter of 100 units. The number mean, or arithmetic average, diameter or D(1,0) for this group of particles is calculated as follows:
D[1,0] = (10*1 + 1*100) / (10 + 1) = 10 units
This confirms that the D[1,0] is weighted towards the fines. If the large particle breaks into two, each with a diameter of 79.37 units (thereby conserving mass) then the D[1,0] for the population becomes:
D[1,0] = (10*1 + 2*79.37) / (10 + 2) = 14.06 units
This is a 40.6% increase in size, and as such clearly fails to reflect particle attrition.
On the other hand, we could consider the D[4,3]. Here, the proportion of particles at each size is weighted according to their volume when calculating the mean size. So for the first population, the D[4,3] is:
D[4,3] = (10*1*13 + 1 * 100 *1003) / (10 * 13 + 1 * 1003) ≈ 100 units
This confirms that the D[4,3] is weighted towards the coarse material. The break-up of the large particle into two results in the following D[4,3]:
D[4,3] = (10*1*13 + 2 * 79.37 *79.373) / (10*13 + 2*79.373) ≈ 79.37 units
This moment of distribution mean is clearly able to detect the change caused by particle break-up, although it shows little sensitivity to the fines population.
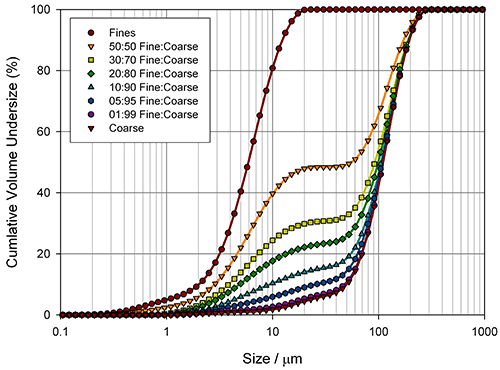
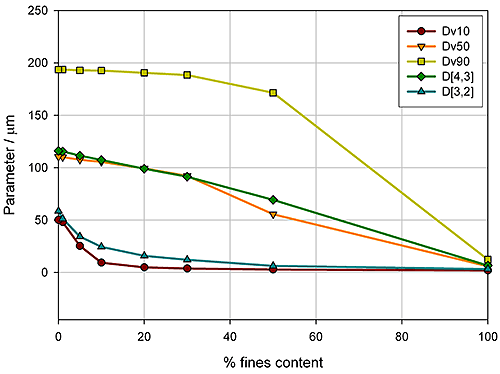
Measuring how sensitive different particle size parameters are to changes in a sample is a good way of determining the best basis for a specification. Figure 4 shows particle size distributions, measured for the blending of two excipient grades, generated using laser diffraction (Mastersizer 2000, Malvern Instruments).
|
Here the aim was to assess the ability of the instrument to detect small changes in the fines content. Detecting the relative proportion of fines and coarse material in a blend is a common application, since particle size distribution often has an influence on important properties such as flowability. In the formulation of dry powder inhalers, for example, the inclusion of fine excipient particles blended with coarser carrier particles is an established way of enhancing drug delivery, because it improves the aerosolisation process. Figure 5 shows how various size descriptors change with increasing fine material content in this case.
|
For this example it is obvious that Dv10 and D[3,2] can only track changes in the particle size at low fines content (<10%), whereas Dv90 only shows sensitivity at high fines contents (>40%). In contrast, the Dv50 and D[4,3] show a linear change as the percentage of fine material increases, and therefore provide a means of differentiating between blends across the range tested here. These parameters may therefore be more appropriate for a specification, although this does depend on the range of possible blends which could occur in production. If the fines content is never greater than 10%, the Dv10 or D[3,2] may provide a more sensitive measure of change, as the rate of change of these parameters is greatest below 10% fines.
Techniques such as laser diffraction offer excellent repeatability, reproducibility and robustness, producing good quality data with minimal manual input or expertise. High repeatability means that the same sample, run on the same machine, produces very similar results. It therefore depends solely on the instrument and reproducible dispersion of the sample. Reproducibility is a more demanding parameter that quantifies the variability introduced by a change of operator, sample, time, and instrument. Sampling methodology consequently becomes important. Measurement variability informs the final step of specification setting: the determination of acceptable tolerances.
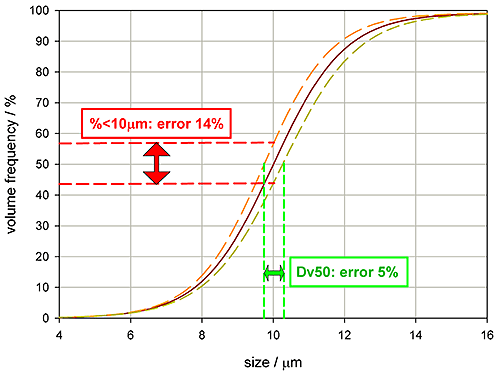
Setting appropriate tolerances for a specification requires an appreciation of measurement errors as well as an understanding of the correlation between the variable and product performance. Figure 6 shows some particle size distribution data, the red line being a typical reading, the yellow and orange lines quantifying reproducibility, the range of variability associated with the reading.
If the specification for this product is a Dv50 of 10 microns, then the plot shows that the measurement variability will be +/- 5%. However, it would be wrong to assume that the same tolerance can also be used for the percentage less than 10 microns. Due to the slope of the undersize distribution curve, a specification requesting that 50% of the volume of material must be 10 microns size or less would be subject to a measurement variability of +/-14%.
|
This analysis highlights a fairly obvious point: as measurement variability increases confidence in the reported result should reduce. Although this concept is readily appreciated it is not always properly accounted for in specifications. Here is a specification for a tableting blend [Evolutions in Direct Compression, Douglas McCormick, Pharmaceutical Technology, April 2005. Pg 52-62]:
Dv10 > 30 μm
D[4,3] > 80 μm
Dv90 < 1000 μm
The tolerances above do not take into account any error introduced by measurement, but rather reflect the ideal material for optimal production. Dv10 should be greater than 30 microns, D(4,3) greater than 80 microns, and the Dv90 should be less than 1000 microns. USP <429> [General Chapter <429> (2008), "Light Diffraction Measurements of Particle Size," United States Pharmacopeia. www.usp.org] provides acceptable reproducibility figures for particle size measurement, suggesting that the Dv50 and other central measures should be within 10%, and non-central values such as Dv10 and Dv90 should be within 15%. If the analytical technique used delivers this performance, what does that mean for the specification?
If the USP<429> reproducibility limits are applied, a Dv10 measurement of 30 microns could be recorded for a sample with a Dv10 of up to 34.5 microns (15% error). If the aim is to ensure that the material actually has a Dv10 greater than 30 microns, the specification will need to be changed accordingly. Applying the same approach for each parameter produces the following measurement specification which needs to be followed if the manufacturing specification above is to be met:
So, tolerances should be reduced to incorporate the errors introduced by the measurement technique, less accurate methods resulting in tighter specifications. This provides impetus for the procurement of instruments with high reproducibility and the development of robust methodologies.
Setting specifications on the basis of product understanding is a key element of QbD and essential for effective quality control. For many pharmaceuticals particle size is a Critical Quality Attribute, a variable that must be tightly controlled because it directly impacts performance, so specification and measurement is routine within the industry. Recognizing the parameters that different particle sizing techniques deliver, and the relevance of alternative size descriptors, is crucial for the development of a relevant specification, as is the refinement of tolerances in line with the accuracy of the method.
Laser diffraction is an ensemble particle sizing technique that delivers volume-based distributions. It is suitable for many applications within the sector and is particularly sensitive for the detection of over-sized material. Systems such as the Mastersizer 2000 deliver highly repeatable results (+/-1%) reducing the need to tighten tolerances to account for measurement inaccuracy. Furthermore, because laser diffraction is well-established as a process analytical technique a specification developed in the laboratory can be transferred during scale-up. The successful transfer of specifications that are as broad as possible, within the constraints of meeting performance targets, is a route to optimized manufacture and reduced cost.