
In terms of enumerating particulate matter in parenteral biotherapeutics, the regulatory position is covered in USP general chapters <787> and <788>1. These chapters accept that some particulate matter may be present in the product, and limits are set based on the size and number of particles. However, not all particulate matter is ‘made equal’ and particles originate from a variety of sources. USP <1787> describes three different categories of particulate matter2:
As USP <1787> informational chapter states:
“Because multiple potential sources of particles exist, it is important to identify the particles and determine whether they are extrinsic, intrinsic, or inherent. Once this has been accomplished, it is possible to develop and apply appropriate control strategies. If deviations occur, particle identity will guide the root cause analysis, risk assessment, corrective actions, and control strategy.”
One of the techniques for particle identification described in this chapter is Raman Microspectroscopy, which involves using a light microscope to target individual particles for Raman spectroscopy. The identification can be rapid and can take place in the native suspension or when filtered. However, locating these particles requires both a substantial amount of time and a highly-skilled operative.
In this application note, we describe an automated method of Raman Microspectroscopy whereby the sample is scanned, and particles are located by image analysis. The particles are then targeted for Raman analysis, according to their morphological descriptors. This technique is known as Morphologically-Directed Raman Spectroscopy (MDRS®), is performed using Malvern Panalytical’s Morphologi 4-ID, and is increasingly used to determine component-specific particle size and shape3-6. In contrast to manual Raman microscopy, not only does the use of MDRS decrease the time and burden on the analyst, but it also enables enumeration of the particles and stores particle images with their spectral information. Thus, both the robustness of the test and the ability to audit the data are improved. Here we describe the use of MDRS for automatic identification and enumeration of particulate matter in a biotherapeutic product.
Please login or register for free to read more.
In terms of enumerating particulate matter in parenteral biotherapeutics, the regulatory position is covered in USP general chapters <787> and <788>1. These chapters accept that some particulate matter may be present in the product, and limits are set based on the size and number of particles. However, not all particulate matter is ‘made equal’ and particles originate from a variety of sources. USP <1787> describes three different categories of particulate matter2:
As USP <1787> informational chapter states:
“Because multiple potential sources of particles exist, it is important to identify the particles and determine whether they are extrinsic, intrinsic, or inherent. Once this has been accomplished, it is possible to develop and apply appropriate control strategies. If deviations occur, particle identity will guide the root cause analysis, risk assessment, corrective actions, and control strategy.”
One of the techniques for particle identification described in this chapter is Raman Microspectroscopy, which involves using a light microscope to target individual particles for Raman spectroscopy. The identification can be rapid and can take place in the native suspension or when filtered. However, locating these particles requires both a substantial amount of time and a highly-skilled operative.
In this application note, we describe an automated method of Raman Microspectroscopy whereby the sample is scanned, and particles are located by image analysis. The particles are then targeted for Raman analysis, according to their morphological descriptors. This technique is known as Morphologically-Directed Raman Spectroscopy (MDRS®), is performed using Malvern Panalytical’s Morphologi 4-ID, and is increasingly used to determine component-specific particle size and shape3-6. In contrast to manual Raman microscopy, not only does the use of MDRS decrease the time and burden on the analyst, but it also enables enumeration of the particles and stores particle images with their spectral information. Thus, both the robustness of the test and the ability to audit the data are improved. Here we describe the use of MDRS for automatic identification and enumeration of particulate matter in a biotherapeutic product.
When performing foreign particle analysis on protein formulations using the Morphologi 4-ID, one of two sample preparation methods can be used, depending on the specific requirement:
Characterizing particles in their native state is preferable to any further processing because the preparation process itself might induce changes in the sample. For example, drying out protein particles will likely change their size and shape and the very action of filtering may promote aggregation. The Thin Path Wet Cell enables the analysis of samples in their native state, but this method may present challenges for the analyst. The first of these challenges is the possibility of collecting images of very low contrast particles. Fully-hydrated proteins suspended in an aqueous medium can be very difficult to see with light microscopy. Using the Sharp Edge Low Contrast segmentation algorithm can help solve this issue, as seen in the example particle images in Figure 1.
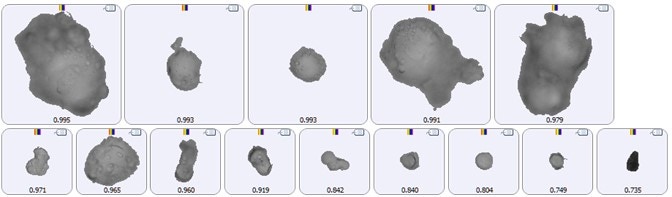
Figure 1. Example images of low contrast protein particles suspended in an aqueous medium
The second challenge is the collection of Raman spectra from low-density protein particles via a quartz window. This is very relevant for proteins as they typically have a low Raman cross-section, meaning they are weak Raman scatterers and can be challenging to identify. The recommendation therefore is to use high laser power and increase the exposure time for Raman collection. The spectra seen in Figure 2 are from protein particles analyzed using the Thin Path Wet Cell with an exposure time of 300 seconds. Longer exposure times of 600 seconds have also been used to identify very weak Raman scatterers, but this inevitably limits the number of particles that can be identified in a given timeframe.
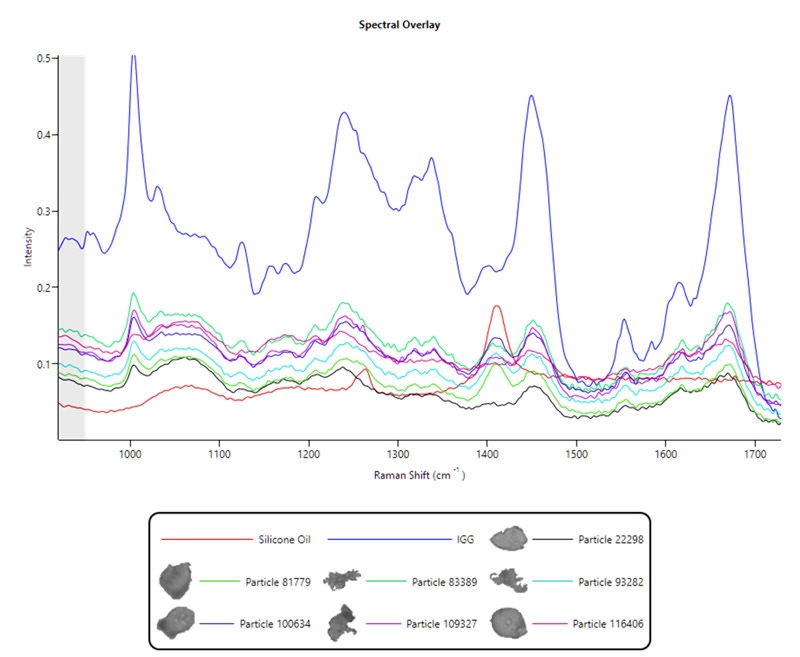
Figure 2. Thin Path Wet Cell Raman spectral data from protein and protein-silicone oil agglomerated particles compared against silicone oil (red) and protein (IGG, blue) reference spectra
Interestingly, there is a clear peak around 1410 cm-1 in the protein spectra in Figure 2. This may be identified as silicone oil – a known lubricant and typically an intrinsic particle. This is a further benefit to analyzing the sample in its native state using the Thin Path Wet Cell, as immiscible oils such as silicone oil will pass through filter substrates or spread too thinly on them to be identified.
The objective of this test is to positively identify particles by comparing their Raman spectra against a library of standard spectra. Figure 3 shows spectra from six particles and a protein reference spectrum. The table contains the library of reference spectra used in this test and the particles’ spectral correlation scores. All six spectra in Figure 3 correlate most closely with the protein reference spectrum, highlighted in green.
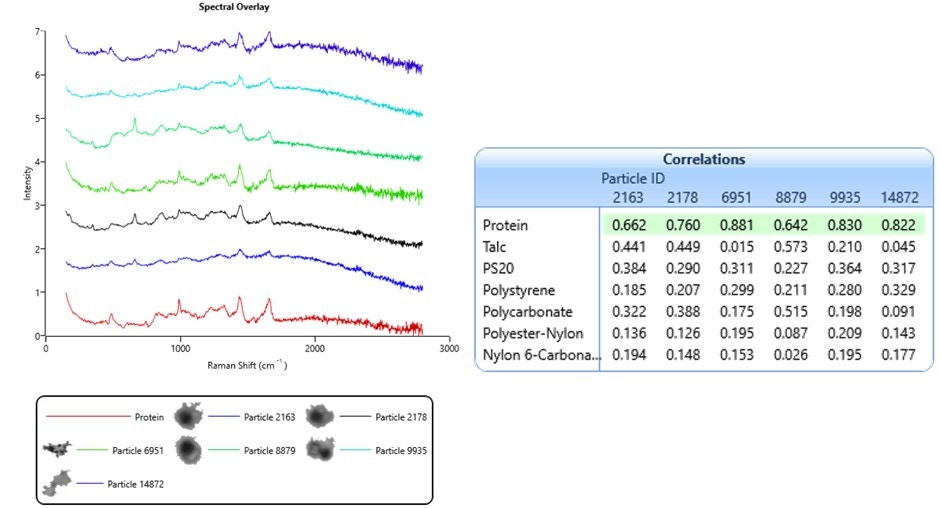
Figure 3. Raman spectra from a sample taken from a fused silica filter, showing correlation scores to reference library spectra
High correlation scores are also dependent on Raman spectral quality. As discussed above, using high laser power and long exposure times will improve spectral quality. The sample analyzed in Figure 3 was prepared on a fused silica filter substrate. Here, there was no quartz window or suspension medium to interfere with the laser light path. Furthermore, the protein particles were somewhat dehydrated, which increased their density. This did mean that their size and shape were likely different from their native state, but the benefit was an increase in Raman signal. As a result, the exposure times for these spectra was 30 seconds –shorter than those from the Thin Path Wet Cell in Figure 2 by a factor of 10.
As described above, Raman exposures of 30 seconds – 600 seconds for these types of particles can be expected. But what exposure time is required to give a satisfactory result?
Using the fully-automated MDRS method and fused silica filters, a protein sample was analyzed using exposure times of 30 seconds and 300 seconds. As expected, the Raman spectral quality was higher when collected for 300 seconds (data not shown). However, as Figure 4 shows, whilst there were minor differences between absolute particle numbers collected during the two exposure times, their relative proportions remained approximately the same, and showed that the protein sample was highly contaminated with talc and polymer. These types of materials could be intrinsic or extrinsic. There were also proteinaceous aggregates and polysorbate 20 particles present, which were likely inherent. As a result of such analysis, a control strategy could be developed to establish if a deviation had occurred.
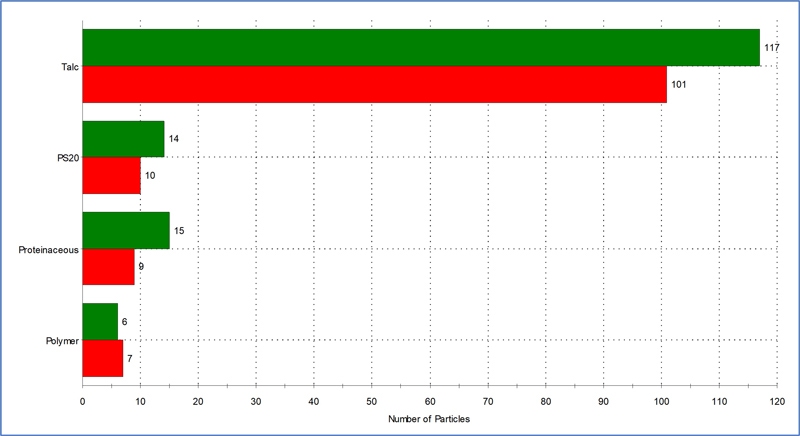
Figure 4. Particle identification and count for the protein sample prepared using a fused silica filter and analyzed using MDRS. Raman exposure times of 300 s (green) and 30 s (red).
Fundamentally, the objective of using Raman microspectroscopy for the analysis of parenteral biotherapeutics is to identify enough particles to establish if a deviation has occurred. This requires identifying and categorizing particles as inherent, intrinsic or extrinsic, and setting a control strategy for each. However, amorphous protein particles have considerably weaker Raman spectra than their crystalline equivalents. This necessitates a longer exposure time to positively identify the material as protein, which will substantially increase the overall analysis time. However, this should be balanced against the objective of the test. Is it useful to identify proteinaceous materials, or is it more important to establish the nature of other materials in the sample? As such, it is recommended to explore the exposure times required for identification.
Choosing to analyze the sample in its native state using the Thin Path Wet Cell has its benefits, including the avoidance of disruption of protein particle shape and size. However, the quality of the Raman data may be compromised, which in turn may compromise the objective of the test. Therefore, it is also recommended to explore the different dispersion methods of suspension and filtration, during method development.
Finally, by automating the test using the MDRS technique, both qualitative and quantitative chemical information can be derived with a minimal burden on the analyst. This leads to a more rigorous test and a more robust control strategy.