Oxygen therapeutics are administered to patients to improve the oxygenation level of their tissues. They are developed to be used where blood transfusions may not be easily accessible. Advantages of oxygen therapeutics are their extended stability (1-3 years) compared to blood (45 days) and easier handling as some of them do not need to be kept refrigerated.
Many of the oxygen therapeutics are based on modified hemoglobin (hemoglobin based oxygen carriers, HBOC). The size of HBOCs has been shown to correlate with the extent of extravasations and renal filtration that occur in the body upon administration, two factors responsible for the toxicity of these products in patients [1].
Unmodified hemoglobin breaks up into dimers (<40kDa). The body quickly eliminates the dimers via the kidneys, a process that is potentially toxic if the body tries to dispose large amounts of hemoglobin. Hence HBOCs need to be modified to prevent rapid separation of the hemoglobin molecules. Extravasation is the process where hemoglobin leaks into the surrounding tissue in the blood vessels, causing constriction of the blood vessels and increase in blood pressure. The size of the molecules that can leak into the endothelial tissue is determined by the pore size of the capillaries, which has been estimated to be 50nm maximum [2].
Therefore, the determination of the size of HBOCs is fundamental to avoid adverse effects upon administration to patients.
In this application note, the sizes of HBOCs have been determined by dynamic light scattering (DLS), and the thermal stability of these constructs have been investigated and compared to human hemoglobin A.
The work presented here focuses on two HBOC candidates; both PEGylated hemoglobins, one obtained under aerobic conditions called PEGHboxy and mimicking the MP4 product (Hemospan®) from Sangart, and another obtained under anaerobic conditions, called PEGHbdeoxy. Both are hemoglobin molecules (64 KDa) conjugated with a number of 6-8 polyethylene glycol (PEG) chains (5.5 KDa).
All measurements were performed on the Zetasizer Nano (Malvern Instruments), a dynamic light scattering (DLS) instrument, using NIBS detection. DLS measures the time dependent fluctuations in scattered light from molecules in a solution to determine the translational diffusion coefficient and subsequently the hydrodynamic radius (RH) from the Stokes-Einstein equation.
The DLS measurements were performed at 25°C. Thermal stability measurements were performed between 20°C and 90°C.
To estimate the apparent molecular weight, a globin specific calibration curve was used [3].
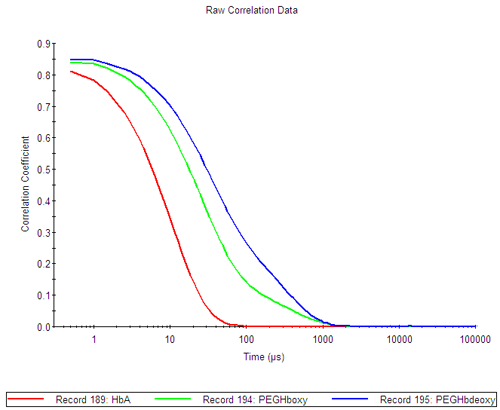
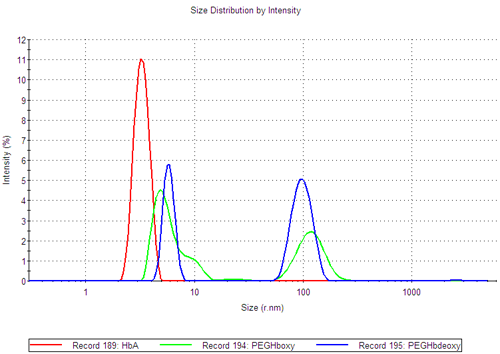
From the bimodal correlation functions of the PEGylated hemoglobin samples (figure 1A), it is clear that the samples contain several populations of molecules (green and blue curves).The size distributions by intensity (figure 1B), show that both PEGylated hemoglobin samples contain at least two distinct populations and PEGHboxy probably contains a third population visible as a shoulder on its smaller size peak. In contrast, the human hemoglobin A sample shows a monomodal size distribution.
|
|
|
The PEGHboxy (green) has a tail supporting the presence of a second population close to the first size peak.
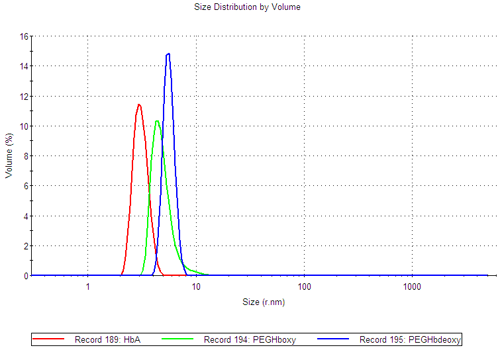
Mie theory can be used to convert the size distribution on a volume basis (figure 1C), providing information on the relative proportions of the various populations. In both of the PEGylated samples, the majority of the sample is contained in the smaller size peak (99.9%).
The apparent molecular weight of the PEGylated hemoglobins was estimated by using a calibration curve for globins [3]. The molecular weights corresponding to the smaller size peak of the PEGylated globins are 108kDa and 165kDa for PEGHboxy and PEGHbdeoxy, respectively.
In thermal stability measurements, the sample scattering intensity is used as a parameter to follow the aggregation of proteins. The amount of scattered light depends on the size of the molecules, and is proportional to the RH6. As a consequence, a particle of 10nm scatters a million times more than a 1nm particle. Hence, as the protein is aggregating, the scattering intensity will increase until the entire sample is aggregated.
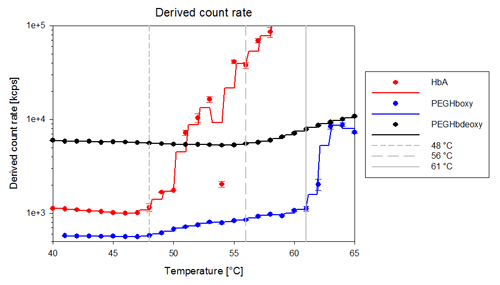
Thermal stability trends of the human hemoglobin A and the two PEGylated hemoglobins show diverse behavior and they rank from the least to most stable: human hemoglobin < PEGHboxy < PEGHbdeoxy. Figure 2 shows the thermal stability trends for the samples.
|
The thermal induced aggregation of human hemoglobin (HbA) occurs dramatically around 48°C, where the sample goes from a well defined molecule to large aggregates.
PEGHboxy shows a two step thermal denaturation, the first phase starting around the same temperature as the human hemoglobin denatures (48°C), where for the PEGHboxy, the intensity slowly starts to increase indicating an increase in the particle size. The increase in size was confirmed by the DLS distribution analysis. In the second phase starting at 61°C, the PEGHboxy sample rapidly aggregates into large particles. These results demonstrate that PEGylation of human hemoglobin clearly stabilizes hemoglobin.
Unlike Human Hemoglobin and PEGHboxy, the PEGHbdeoxy sample does not show the same formation of large aggregates as the other two, but shows instead a slow increase in intensity starting around 56°C, indicating an increase in the sample size, see figure 2. The thermal trend for the PEGHbdeoxy sample is detailed in figure 3. These results suggest that the preparation of the PEGHbdeoxy under anaerobic condition generates a more stable complex which resists temperature increases better than the PEGHboxy.
|
|
|
The distribution analysis provides information on the changes in the individual populations of the sample.
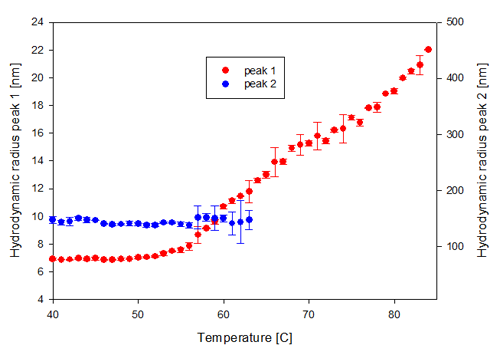
At 25°C PEGHbdeoxy shows two distinct populations at RH1 ~ 7nm and RH2 ~ 150nm (figure 1B). As the temperature increases, the size of these populations changes as well as their contribution to the scattering intensity.
The changes in the hydrodynamic radii of the two populations in the PEGHbdeoxy sample are shown in figure 3A, confirming that the increase in scattering intensity starting at 56°C is due to a change in size of the smaller size population. The increase in size can be interpreted as unfolding and/or aggregation of the unfolded PEGylated protein. The second population, with a hydrodynamic radius of 99nm disappears at temperatures above 65°C.
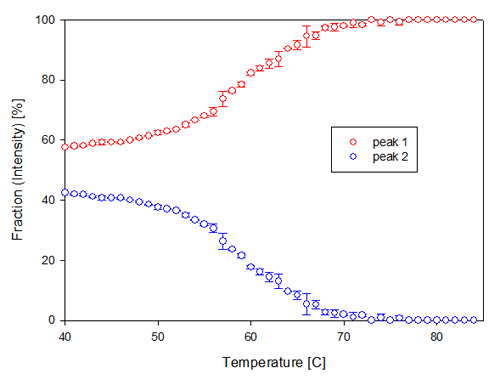
In figure 3B, the contribution to the total intensity of the sample from each of the two populations present in the PEGHbdeoxy sample, are shown. The smaller size population increases its contribution to the scattering intensity with increasing temperature while the second, larger, population slowly disappears over the temperature range. This could indicate the dissociation of loosely bound aggregates.
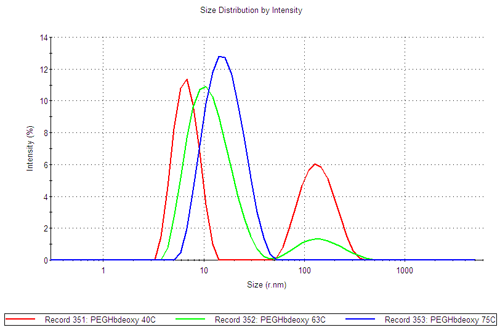
In figure 3C, PEGHbdeoxy size distributions at three characteristic temperatures, 40, 63 and 75°C, illustrate the increase in size of the smaller population and the decrease in the larger population with increasing temperature.
These measurements demonstrate that the PEGHbdeoxy sample contains two distinct complexes at temperatures up to 50°C, although the majority of the sample (99.9%) is contained in the smaller size peak.
In this application note, DLS has effectively been used in the development of HBOCs to determine the size of the PEGylated hemoglobin samples and human hemoglobin.
Thermal stability trend studies were carried out on human hemoglobin and the two HBOC candidates, providing evidence that PEGylation stabilizes hemoglobin. DLS analysis also provided detailed information on the process of thermal denaturation and clearly showed differences in stability between the PEGylated globin samples.
DLS is shown to be a fast alternative to gel filtration chromatography for monitoring the size and oligomeric state of proteins, with the additional possibility of monitoring thermal stability.
[1] Bucci E., Kwansa H., Koehler R.C., and Matheson B., Development of Zero-Link Polymers of Hemoglobin, Which do not extravasate and do not induce pressure increases upon infusion. Artif Cells Blood Substit Immobil Biotechnol. 2007 35(1):11-18
[2] Rippe B, Haraldsson B. Transport of macromolecules across microvascular walls the two-pore theory. Physiol Rev. 1994;74:163-219.
[3] "Size measurements and molecular weight estimation of globins", MRK1293-01
These results were obtained by Drs. Stefano Bruno, Serena Faggiano, and Luca Ronda at University of Parma, Italy with the help of Alice Brun, Alfatest srl, Italy.