Introducing a new approach for dry powder inhaler characterisation, which combines automated imaging and cascade impaction to measure the particle size and shape distributions for particles which have been aerosolized. This aids understanding of the dispersion of the formulation during device actuation.
In this note we show how the Morphologi automated imaging system can be used to understand the degree of powder dispersion achieved during the operation of a dry powder inhaler by analysing powder fractions collected using cascade impaction.
During research and development of orally inhaled and nasal drug products (OINDPs) Next Generation Impactors (NGIs) are well accepted and routinely used as a method to assess the aerodynamic particle size distribution of the drug in a formulation. This technique is described in both the European1 and United States Pharmacopeia2, which specify test methods for use with Dry Powder Inhalation (DPI) formulations. In general, it is accepted for DPI formulations that, to specifically target drug delivery to the lungs, the particles should be in the 1 to 5 micron size range. The aerodynamic size of particles expected to be collected at each stage of an NGI is calculated according to the flow rate of actuation as described in the Pharmacopeia.
An important advantage of the NGI as a particle sizer over other techniques is that, as well as classifying particles according to their aerodynamic particle size, it allows the chemical specificity of the particles to be determined via High Pressure Liquid Chromatography (HPLC). Thus, the fraction of active pharmaceutical ingredient (API) of the appropriate size to reach the target site can be assessed. However, the disadvantage of this method is that HPLC analysis requires the dissolution of collected particles, which means that all information about the physical properties of the particles at each stage is lost.
It is also of interest to gain a better understanding of the physical properties of a material, especially whether particles delivered to the lower stages of the impactor are agglomerated or well dispersed primary particles. Characterization of particles collected on each stage of an impactor by automated image analysis allows the particle size and shape to be assessed in a quantitative manner and allows the particles and agglomerate structures to be visualized.3
Another benefit in combining the techniques of NGI particle classification with image analysis is that the classification of a powder into narrow size classes by the NGI ensures the material on each stage is within the size range for measurement using a single microscope objective (ie. Magnification). Therefore, concerns relating to the dynamic range for image analysis measurements are addressed.
The aims of the study were two fold:
An experimental lactose/budesonide DPI formulation was used composed of milled lactose fines (LH210) added to a coarse lactose carrier (LH100) (both from DFE Pharma, Borculo, Netherlands) at 20 wt% concentration blended with budesonide at 0.8 wt% concentration.
A size 3 hydroxypropylmethylcellulose (HPMC) capsule (Qualicaps, Spain) was filled with 12.5 mg of the formulation, which was aerosolized using the Cyclohaler® at a flow rate of 90 l/min for 2.7 seconds into a NGI equipped with pre-separator (Copley Scientific, Nottingham, UK).
The NGI was set up in a standard configuration with the addition of a microscope slide coverslip placed in each of the collection stages and in the pre-separator inlet. After actuation, particles were deposited on the coverslips which were transferred to a Morphologi G3 and analyzed by automated image analysis.
Several microscope objectives were required to cover the range of particles sizes collected in the different NGI cups, a 10x objective was used for the pre-separator sample, a 20x for the stage 1 sample and a 50x with z-stacking for the stage 2 - 6 samples. Z-stacking combines images taken at different heights from the substrate, ensuring both large and small particles are in focus simultaneously. Measurements of stages 7 and 8 were not carried out as particles collected on these stages were too small (sub 0.5 µm) for optical analysis. A post analysis filter was applied to the results to remove images of touching particles from the final result. When comparing shape, only samples analyzed with the 50x magnification were included and a further filter was applied to each raw result to remove images containing less than 100 pixels to ensure adequate resolution for shape analysis.4
|
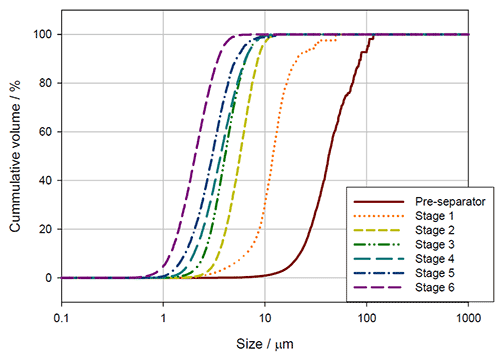
Figure 1 presents the overlay of the volume based cumulative Circular Equivalent Diameter (CED) distributions for the samples collected from the different NGI stages. A clear decrease in size is identified, as expected, from the pre-separator sample through to the stage 6 sample.
Table 1 summarizes the volume based size results from the image analysis experiment in terms of width, length and Circular Equivalent Diameter (CED) and the calculated Mass Median Aerodynamic Diameter (MMAD). 5
| Morphologi measured volume based size parameters (μm) | NGI
calc'd size (μm) | ||||||||||
|---|---|---|---|---|---|---|---|---|---|---|---|
| Sample
Name | #
Particles | Width
D[v, 0.1] | Width
D[v, 0.5] | Width
D[v, 0.9] | CED
[v, 0.1] | CED
[v, 0.5] | CED
[v, 0.9] | Length
D[v, 0.1] | Length
D[v, 0.5] | Length
D[v, 0.9] | D50
@ 90 l/min |
| NGI
presep inlet | 6559 | 18.35 | 35.85 | 75.40 | 22.07 | 42.26 | 87.21 | 27.24 | 54.70 | 111.6 | |
| Stage 1 | 17446 | 5.307 | 10.03 | 18.74 | 6.55 | 11.95 | 20.90 | 8.49 | 15.96 | 28.86 | 6.48 |
| Stage 2 | 23862 | 2.937 | 4.80 | 7.61 | 3.51 | 5.68 | 8.55 | 4.33 | 7.43 | 11.63 | 3.61 |
| Stage 3 | 88260 | 2.143 | 3.41 | 5.84 | 2.54 | 4.05 | 6.51 | 3.07 | 5.32 | 8.921 | 2.30 |
| Stage 4 | 102024 | 1.731 | 3.13 | 5.78 | 2.01 | 3.66 | 6.46 | 2.43 | 4.76 | 8.624 | 1.37 |
| Stage 5 | 31136 | 1.446 | 2.62 | 4.57 | 1.64 | 3.03 | 5.24 | 1.97 | 3.84 | 7.013 | 0.76 |
| Stage 6 | 96897 | 1.099 | 1.79 | 3.10 | 1.18 | 2.06 | 3.47 | 1.35 | 2.51 | 4.475 | 0.43 |
A linear relationship was observed between the calculated MMAD and the measured CED Dv50 for stages 1 to 3, where the CED Dv50 value is approximately twice that of the calculated MMAD. A one to one linear relationship was observed for the CED Dv10 values and the calculated MMAD. The lower stages show poorer agreement between the MMAD and the Dv50 or Dv10. These observations may be related to the to the fundamentally different methods of particles sizing employed i.e. aerodynamic particle sizing vs. sizing according to the 2D projected area and the fact that some particles reaching the lower stages are too small to be analyzed by an optical system. As well as particle size, an image analysis experiment allows the particle shape of the samples to be investigated.
|
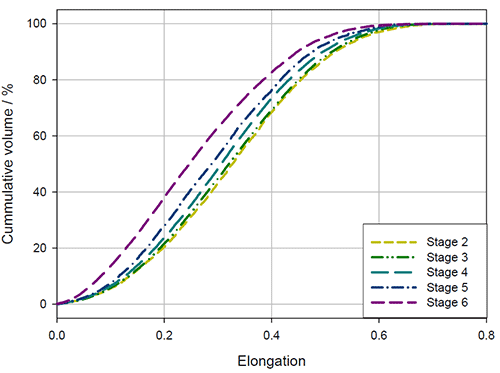
Figure 2 shows that on subsequent stages of the NGI from stage 2 to stage 6, the Elongation (1-(width/length) decreased, indicating that the particles become more symmetrical in nature. This observation suggests there may be a dispersion effect, with agglomerates being observed in the upper stages and primary particles being delivered to the lower stages of the impactor.
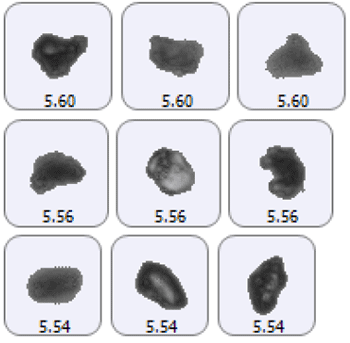
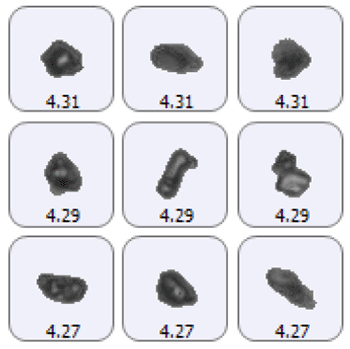
Furthermore, images of every particle analyzed during the image analysis experiment are captured allowing a qualitative verification of the quantitative data.
|
|
|
|
|
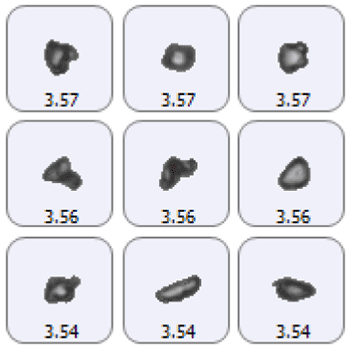
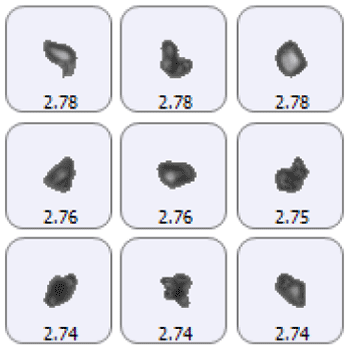
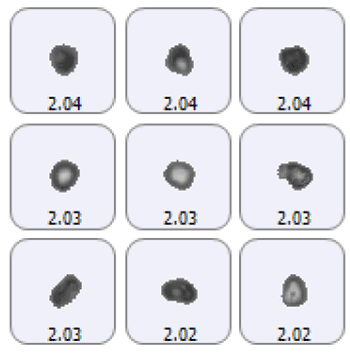
Figure 3 provides example images of particles collected from stages 2 - 6 of the NGI, with particle sizes close to the CED Dv50 value. Visual inspection of the images broadly agrees with the trend in Elongation decreasing across subsequent stages.
Capturing aerosolized particles on coverslips placed in the stages of an NGI allows the physical properties of the particles to be characterized by image analysis. For stages 1 to 3 the calculated aerodynamic particle size agrees well with the Dv10 in terms of CED. The Dv50 CED is double the value of the calculated aerodynamic particle size . Furthermore, the ability to compare the physical properties of particles collected from different stages of the impactor, and to capture particle images, allows a better understanding of the deposition of formulation through the impactor. For the formulation studied here, as well as the expected decrease in size across subsequent stages, a clear trend in terms of reduced Elongation was established suggesting an increased degree of dispersion on lower stages.