The morphology and chemical composition of complex powder mixtures are often found to be Critical to Quality in pharmaceutical products. The Morphologi® ID instrument provides component-specific characterization of particle size and shape of particles within a powder blend. This information helps with the deformulation of a reference listed drug providing information for a generic formulation development. Here, we present an example case study of a generic peroral drug product compared against an equivalent commercial brand product.
According to the definition established by the FDA, a generic drug is "a drug product which is comparable to a reference listed drug (RLD) product in dosage form, strength, route of administration, quality, performance characteristics, and intended use". Rigorous rules and regulations pertaining to abbreviated new drug application (ANDA) submissions are complex and the generic drug industry strives to meet these regulations to obtain FDA's approval. And being the "first to file" is the most fundamental principle in the generics business because several companies compete to create generics of successful products going off patent. Therefore, generics companies must be highly skilled and disciplined in product development and achieving bioequivalence-the most critical development area.
Though generics companies commonly use deformulation or reverse engineering techniques, the topic and, more importantly, the tools needed to carry out the process are rarely discussed in the public domain. In this application note we discuss one such tool that can be used for oral solid dose formulations.
Two cold remedy formulations were analyzed on the Morphologi® ID from Malvern Panalytical: one was a commercial brand and the other a generic one. Individual components within the formulations were identified by comparing their Raman spectra with those in a commercial database. Once the components were identified the particle size distributions of individual components in each formulation were compared, as was the overall composition of the two formulations.
The cold remedies were dry powder formulations that were automatically dispersed and analyzed using Morphologically-Directed Raman Spectroscopy (MDRS®) on the Morphologi ID. A sample volume of 13 mm3 was dispersed using the instrument's integrated dry powder dispersion unit using the low energy setting.
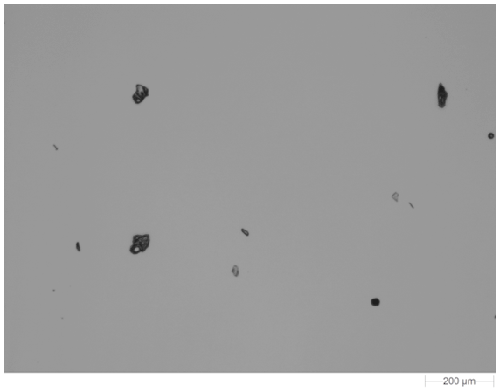
Figure 1 shows an example image of one of the dispersed samples. The samples were imaged at 5x magnification. Particles with a circular equivalent diameter (CED) larger than 25 µm were targeted for the Raman chemical identification. In this case the acquisition time was 10 seconds for each particle and spectra from a few thousand particles from each sample were gathered in an overnight analysis.
|
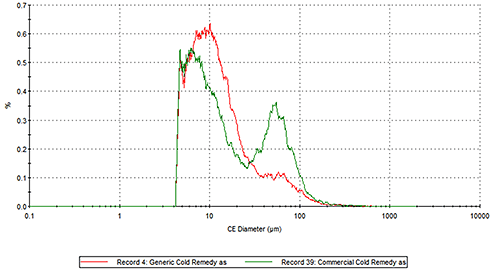
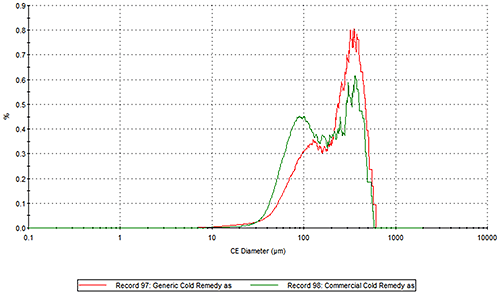
Figure 2 presents the overlays of the Circular Equivalent Diameter (CED) particle size distributions of the two cold remedies by number and volume respectively. The commercial brand contains more particles in the 30 to 200 µm range than the generic brand. The number based distribution indicates the commercial brand also contains more fine particles less than 20 µm in size.
|
|
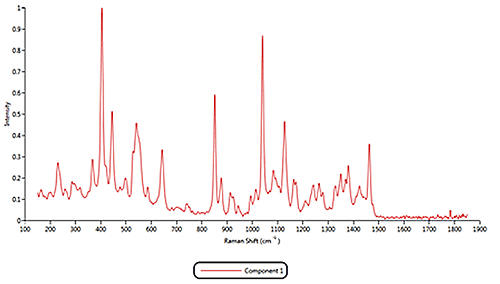
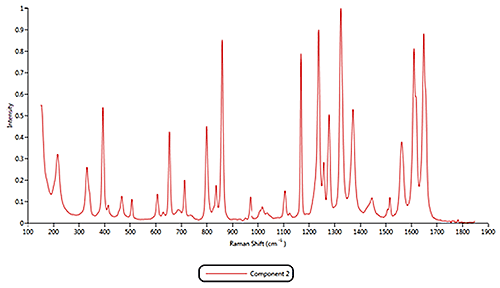
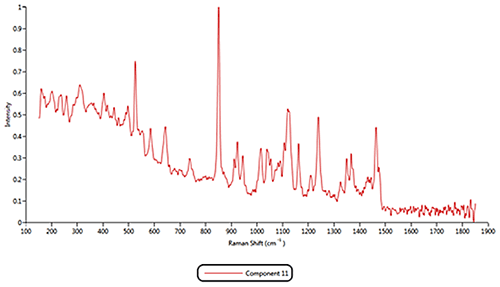
Both of the cold remedies are made of more than ten components, including the two active pharmaceutical ingredients (APIs) Paracetamol and Phenylephrine. An internal reference library of known spectra was created for each of the eleven Raman active components identified in the samples. Example reference spectra for components 1, 2 and 11 are displayed in figure 3.
|
|
|
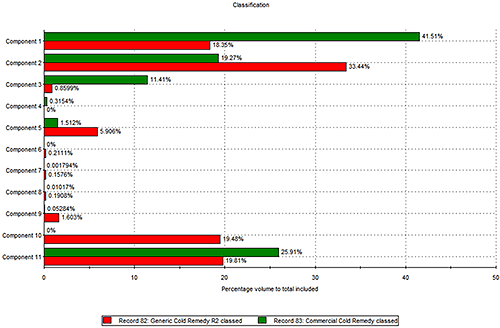
Based on the reference spectra, it is possible to classify individual particles as being one of the formulation components by a correlation score. A score close to 1 indicates a good match whereas a score close to zero indicates a poor match. Chemical classifications based on these correlation scores were applied to the results to identify the proportion of each component present in the two formulations.
The results of the volume based classifications are presented in figure 4. The three most common components in both formulations were components 1, 2 and 11. The commercial product contains more of component 1 than the generic product, whereas the generic product was found to contain more of component 2.
|
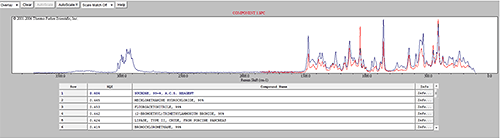
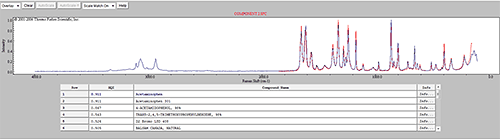
Some of the components were identified by performing an advanced spectrum search using Thermo Scientific's online database 'ftirsearch.com.' Figure 5 shows the result for the identification of Components 1, 2 and 11. Component 2 was found to be Acetaminophen (Paracetamol). Components 1 and 11 were found to be different forms of sucrose.
|
|
|
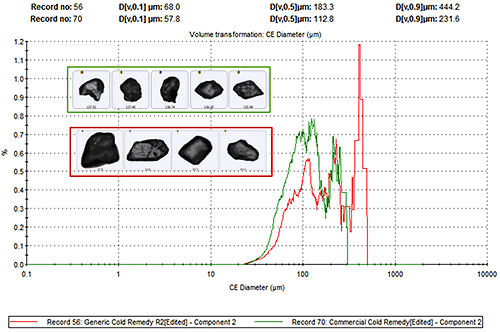
Figure 6 presents the overlay of the volume based CED size distributions for the particles that were classed as Paracetamol in each sample along with example particle images. The generic product contains larger particles of Paracetamol than the commercial product.
|
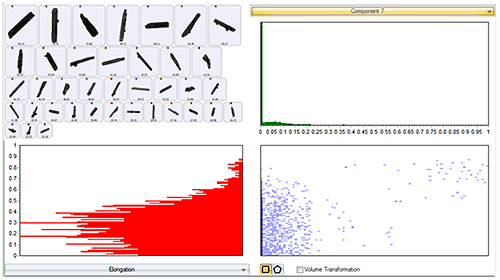
Whilst component 7 was not found to be very abundant in either sample, on comparing the particle shape of the various components, it was found to be considerably more elongated (needle-like) than the others. Figure 7 presents the scattergram of correlation score to component 7 vs. elongation. It shows that all particles with a high correlation score to reference component 7 do have a high elongation. The particle images shown in the top left of the figure also confirm this.
|
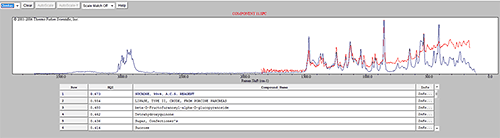
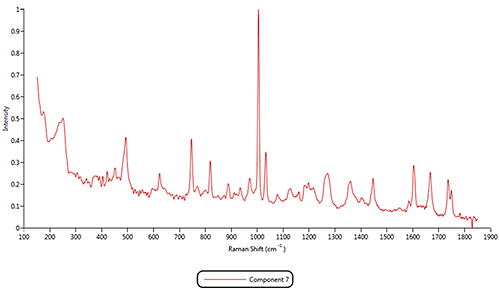
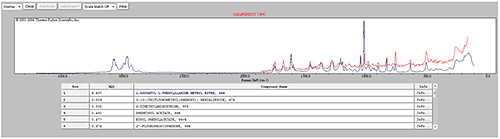
An advanced spectrum search was performed on the reference spectrum for component 7 and it was found to be Aspartame; another known sweetener (figure 8). The generic product contained significantly more Aspartame while the commercial product contained significantly more Sucrose. This difference may have an impact on cost of production, but also on flavor.
|
|
Two different cold and flu remedy formulations were analyzed on the Morphologi ID. Eleven different chemical components were identified and assigned to individual classes. The most abundant classes in both formulations were found to be sucrose and paracetamol. The commercial formulation was found to contain more paracetamol by volume and presented a larger particle size distribution.
Whilst not very abundant in either formulation, aspartame was also identified in both formulations and was found to have a more needle-like particle shape relative to other components. The commercial formulation contained more natural sugar in comparison to the generic product.
Particle size and shape are controlling factors in the time to complete dissolution. Hence, these properties may influence the performance of the formulation, which includes texture, flavor and release of the API(s). Not only is demonstrating equivalent release to the reference product a requirement for ANDA submission, these properties may also impact perceived quality by the patient.