In this application note, we look at how the NanoSight range of instruments uses Nanoparticle Tracking Analysis (NTA) to measure size and concentration of both microvesicles and exosomes (extracellular vesicle) at low concentrations. When used in conjunction with fluorescent labels, it can selectively determine and analyze specific types of particle within a complex sample.
Much interest centers around microvesicles and nanovesicles (exosomes) as they are increasingly cited as potential biomarkers. Whilst definitions in this emerging field currently lack formality, these two classes of bionanoparticle are differentiated both by their size ranges and their biogenesis. Typically, microvesicles are described as being 100 nm to 1 μm in diameter, whilst exosomes are in the range 30 nm - 100 nm in diameter. Microvesicles are typically formed by blebbing of the plasma membrane, whereas exosomes are released by exocytosis from multivesicular bodies of the endosome. Both appear to be involved in cell signaling, carrying a range of signaling proteins as well as messenger RNA and microRNA molecules. Circulating levels are found to be elevated in various disorders, including atherosclerosis and coronary artery disease, haematological and inflammatory diseases, diabetes and cancer.
To date, exosomes research has been constrained by a lack of suitable methods for characterization. The Malvern NanoSight range addresses this need with unique and proven technology. Nanoparticle Tracking Analysis (NTA) allows specific exosomes and microvesicles in the diameter range of 50 nm - 1000 nm in liquid suspension to be directly and individually visualized in real-time. Simultaneously, NTA provides high-resolution particle size distribution profiles and concentration measurements. The technique is easy to use, fast, robust, accurate and cost-effective, representing an attractive complement to existing methods. Operation in fluorescence mode enables characterization and differentiation of suitably-labeled particles using a range of excitation wavelengths.
Both Dynamic Light Scattering (DLS) and NTA measure the Brownian motion of nanoparticles whose speed of motion, or diffusion coefficient (Dt), is related to particle size through the Stokes-Einstein equation.
With NTA, laser light illuminates particles in suspension and a video camera captures the scattered light produced. The particle diffusion is determined by tracking an individual particle's positional changes in two dimensions. Knowing Dt, the particle's hydrodynamic diameter can then be determined.
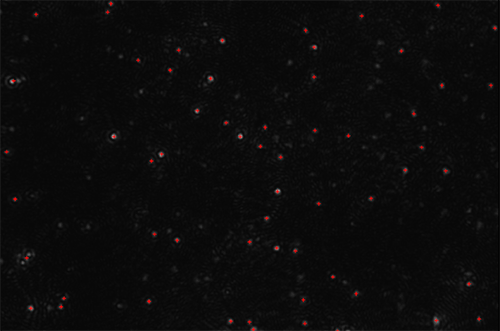
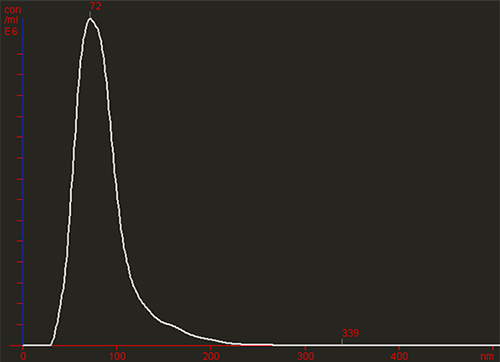
The images below show particles moving under Brownian motion. Initial visual inspection reveals the presence of larger particles or aggregated material (Figure 1A). The NTA software then rapidly generates a high resolution size distribution on a particle-by-particle basis and a count (in terms of absolute number concentration) of the vesicles seen (Figure 1B).
|
|
Traditionally a number of techniques have been used to characterize micro- and nanovesicles with more techniques being available to analyze micro-sized particles. These include:
The most widely used of the above techniques is flow cytometry. Commercial flow cytometry typically has a lower practical size limit (for polystyrene beads) of around 300 nm at which point the signal is indistinguishable from the baseline noise level. Whilst this detection limit can be extended with the use of fluorescent labels, at lower sizes the ability to accurately size such particles is severely limited. DLS has also been used in this application and provides accurate size information for monodisperse samples. NTA can provide additional orthogonal information to DLS where high resolution size distributions are required. Electron microscopy is a useful research tool for studying micro- and nanovesicles but at the expense of capital running costs, extensive sample preparation, slow throughput time, and sample integrity following sample preparation.
Whilst it is often adequate to determine whether particles of a certain size or size range are present in a sample, it can also add value to identify and discriminate specific sub-populations of particles within the sample. The NanoSight technique is capable of selectively analyzing such populations through, for instance, the use of antibody-mediated fluorescence labeling. This approach allows the user to detect and analyze only the specific nanoparticles to which the fluorescently-labeled antibody binds, with background non-specific particulates being excluded through the use of appropriate optical filters. While a range of fluorophores can be used, it is advantageous to employ high-efficiency, high stability quantum dot labels for best results.
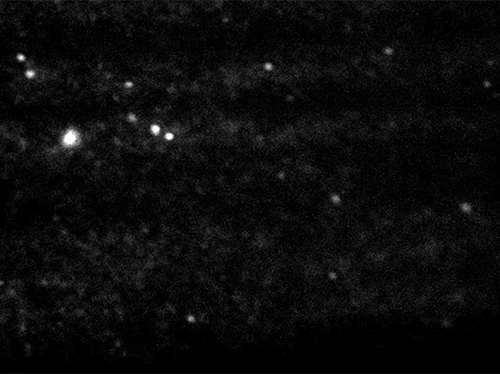
This technique is demonstrated in Figure 2A which shows a single video frame of fluorescent light emitted from quantum dots excited by a NanoSight instrument fitted with an appropriate blue-violet laser diode (405 nm). These quantum dots were used to label an antibody (NDOG II) specific to the target biomarker present on a syncytiotrophoblast microvesicle (STBM).
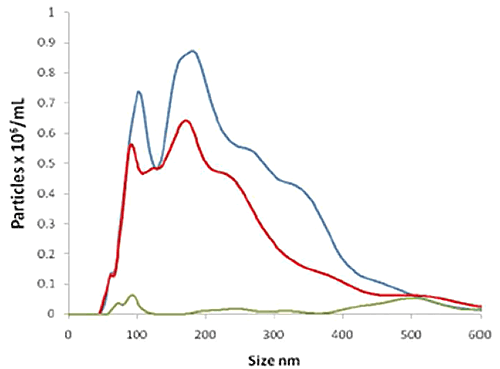
Figure 2B shows three size distributions showing: i) all particles present in the STBM sample (blue line) as detected by (non-fluorescent) light scatter; ii) the particles to which the fluorescent QDot-labeled NDOG II antibody had bound specifically, as measured under fluorescence mode (red line); and iii) a control (green line) comprising a similar QDot-labeled antibody but where the antibody has no affinity to the target biomarker on the STBM (also measured in fluorescence mode). This shows that the majority of the particles present in the sample were successfully and specifically labelled by the STBM-specific Q-Dot-NDOG II antibody and that the control successfully showed a very low signal.
|
|
NTA can size and measure the concentration of both microvesicles and exosomes at a low concentration and, when used in conjunction with fluorescent labels, can selectively determine and analyze specific types of particle within a complex sample.