Learn how to use DSC to screen for physical stability of proteins in solution. The utility of microcalorimetry as a rapid screening tool for assessing the solution stability of high molecular weight pharmaceutical proteins was evaluated using model recombinant antibodies, Protein I and Protein ii. Changes in the transition midpoint, Tm, were monitored as a function of pH and/or in the presence of excipients, and results were compared with traditional accelerated stability data from samples that were analyzed by size exclusion chromatography (SEC). The data from microcalorimetry were well correlated with those from SEC for predicting both optimal solution pH as well as excipient effects on solution stability. These results indicate that microcalorimetry can be an efficient screening tool useful in identifying optimal pH conditions and excipients to stabilize pharmaceutical proteins in solution formulations.
During the past two decades, there has been a rapidly increasing interest in development and commercialization of protein-based therapeutics. One of the greatest challenges during development for such products is the stabilization of proteins in solution. To address this issue, many proteins are formulated as a lyophile that must be reconstituted with a suitable vehicle just prior to use. However, the preference for simpler administration procedures and reduced production costs make development of ready-to-use (RTU) solutions a particularly attractive approach for clinical and commercial drug product formulations, provided sufficient solution stability and adequate shelf life can be achieved. In addition, a large number of protein-based bulk drug substances are provided to development in solubilized form following purification, making identification of an appropriate buffer composition for storage and handling of the bulk protein an important step in the early development process. The studies required to support storage buffer recommendations and RTU solution development for protein pharmaceuticals can be timeconsuming and tedious and often require a significant amount of drug substance to conduct. The design of traditional solution stability studies involves storage of protein solutions of different concentrations in various buffer systems (with or without added excipients) under several stress temperature and/or lighting conditions.
Samples of the solutions are then withdrawn periodically for analysis by one or more methods such as size exclusion chromatography (SEC), gel electrophoresis, and enzyme-linked immunosorbent assay (ELISA). This process can require several weeks or months and grams of bulk drug substance to complete. In an effort to improve efficiency of solution stability investigations for biologics, analytical techniques such as microcalorimetry have been explored as potentially useful screening tools, especially for early evaluation and resolution of possible physical stability issues. Microcalorimetric studies require relatively small amounts of material,1 which can be a particular advantage in early stages of development when drug substance availability is usually limited.
Since unfolding of the native protein to a denatured state followed by aggregation and/or chemical degradation in solution is, by far, the most common pathway of protein inactivation, a thorough investigation of variables affecting this process is critical to successful formulation development. Differential scanning calorimetry (DSC)/ microcalorimetry has been used as a method of characterizing heat induced changes in protein conformation and mechanisms of protein unfolding and stabilization in solution.2-10 In this technique, the energy required to maintain a sample cell containing a protein solution at the same temperature as a reference cell is measured as the system undergoes heating at a constant rate. Energy changes in the sample cell are associated with various thermal transitions including protein denaturation, aggregation, and precipitation and can be monitored as a function of solution variables such as pH, ionic strength, buffer type, etc. Protein unfolding is typically observed as a sharp endotherm positioned at a given temperature known as the transition midpoint, or Tm. The thermal stability of the protein in solution can be estimated by shifts in the position of Tm.11-13 Shifts of Tm to higher temperatures indicate greater protein conformational stability, while shifts to lower temperature indicate increased susceptibility of the protein to thermal denaturation. DSC/microcalorimetry has been useful in the study of protein-protein interactions and protein-ligand binding.3, 11, 14-17 It has also been employed to determine the effect of pH and excipients on the solution stability of polypeptides and proteins.11, 18-29
The current studies were conducted to evaluate the use of microcalorimetry for rapid preliminary screening of pH stability and/or potential RTU solution formulations for two recombinant antibodies, Protein I and Protein II, each with molecular weights of approximately 150 kDa.
Sterile solutions of recombinant Protein I and Protein II were provided by Technical Operations of Bristol-Myers Squibb Company in Syracuse, NY. The initial bulk compositions were 20-25 mg/mL protein in phosphate buffer pH 7.2- 7.4. Solutions of Protein I and Protein II were stored at 5°C until use. All other chemicals were reagent grade and were used as received.
The initial buffer was exchanged with 5 volumes of the desired buffer using Centricon® 30 microconcentrator tubes supplied by Amicon, Inc. (Beverly, MA). The pH of the resulting solutions was adjusted as necessary using either 0.2 N HCl or 0.2 N NaOH. The solutions were then sterile-filtered through a low-protein binding polysulfone filter membrane, and final protein concentrations were confirmed using SEC assay.
The solution stability of Protein I and Protein II was evaluated as a function of pH in 25 mM buffers (sodium acetate, sodium citrate, sodium phosphate, or tris) containing 50 mM sodium chloride. Solutions of Protein I and Protein II at pH ranging from 5 to 9 were prepared using a buffer exchange procedure as described above. The final protein concentrations were 1 mg/mL to 5 mg/mL, and the solutions were stored in thermostatically-controlled stability chambers at 50°, 40°, 30°, and 5°C. Control solutions were stored at -70°C. At predetermined intervals, samples were removed for analysis by SEC and/or other methods. Following identification of optimal storage buffers for each protein, additional studies were conducted to determine the effect of protein concentration on solution stability in those buffers. The protein concentrations evaluated were 25 and 50 mg/mL for Protein I and at 5 and 25 mg/mL for Protein II. In addition, the effect of added excipients on solution stability of Protein I was evaluated at 40°C for two weeks using solutions containing 25 mg/mL Protein I in 25 mM sodium phosphate buffer, pH 7.5, with 10 mM sodium chloride.
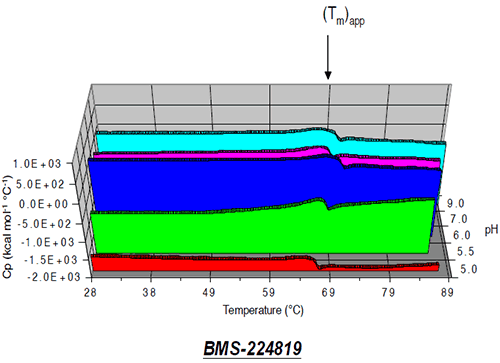
The thermal behavior of sample solutions containing 1 mg/mL Protein I or Protein II in selected buffers with pH ranging from 5 to 9 was analyzed using a MicroCal VP-DSC microcalorimeter. Each sample was degassed under vacuum prior to analysis. Sample and reference cells were heated from 25° to 90°C at a rate of 1°C per minute. Changes in sample transition midpoint temperature, (Tm), were monitored as a function of pH and compared with data obtained from SEC analysis of Protein I and Protein II pH stability samples. In the case of Protein II, only an apparent transition midpoint temperature (Tm)app could be measured due to a tendency of the protein to aggregate irreversibly and precipitate from solution during the DSC run.
Protein concentrations and changes in molecular size were analyzed using SEC. The chromatographic system for SEC assays consisted of a Waters Alliance 2690 HPLC Separation Module equipped with a controlled temperature autosampler maintained at 5°C and a Waters 486 tunable UV absorbance detector operated at a wavelength of 280 nm.
SEC analysis was performed under isocratic conditions, at ambient temperature, using a TosoHaas HP TSK G3000 SWXL size exclusion column (7.8 x 300 mm), with a flow rate of 1 mL/minute and an injection volume of 10 μL. The mobile phase consisted of 20 mM potassium phosphate buffer with 150 mM sodium chloride at pH 6.8.
The results of traditional solution stability studies for Protein I and Protein II stored under various pH conditions are shown in Tables 1 and 2, respectively.
| Conditions | Time | % Remaining by SEC | % Peak Area Aggregate Species | % Peak Area Fragment Species |
|---|---|---|---|---|
| pH 4 acetate Protein I - 5 mg/mL | Initial | 100.0 | 26.5 | 0.0 |
| 1 hour | 29.1 | 80.0 | 0.0 | |
| 4 hours | 17.7 | 88.3 | 0.0 | |
| 8 hours | 14.7 | 91.2 | 0.0 | |
| pH 4 (adjusted with HCl) Protein I - 1 mg/mL | Initial | 100.0 | 40.5 | 0.0 |
| 1 day | 43.9 | 52.2 | 0.0 | |
| 3 days | 31.0 | 92.0 | 0.0 | |
| pH 5 citrate Protein I - 5 mg/mL | Initial | 100.0 | 7.1 | 0.0 |
| 1 hours | 46.0 | 59.0 | 0.0 | |
| 4 hours | 13.9 | 89.2 | 0.0 | |
| 8 hours | 10.5 | 92.4 | 0.0 | |
| pH 5 (adjusted with HCl) Protein I - 1 mg/mL | Initial | 100.0 | 7.8 | 0.0 |
| 1 day | 32.3 | 79.6 | 0.0 | |
| 3 days | 24.6 | 86.9 | 0.0 | |
| pH 6 phosphate Protein I - 5 mg/mL | Initial | 100.0 | 5.3 | 0.0 |
| 8 hours | 79.0 | 26.7 | 0.0 | |
| 24 hours | 58.8 | 46.3 | 0.0 | |
| 48 hours | 46.4 | 59.8 | 0.0 | |
| pH 6 (adjusted with HCl) Protein I - 1 mg/mL | Initial | 100.0 | 4.6 | 0.0 |
| 1 day | 75.8 | 29.1 | 0.0 | |
| 3 days | 63.8 | 42.4 | 0.0 | |
| pH 7 phosphate Protein I - 5 mg/mL | Initial | 100.0 | 3.8 | 0.0 |
| 1 month | 88.2 | 17.9 | 0.0 | |
| 2 months | 76.1 | 23.8 | 1.3 | |
| 3 months | 69.2 | 27.6 | 2.2 | |
| pH 7 (adjusted with NaOH) Protein I - 1 mg/mL | Initial | 100.0 | 2.5 | 0.0 |
| 1 day | 98.2 | 3.2 | 0.0 | |
| 3 days | 100.4 | 2.6 | 0.0 | |
| pH 7.5 Phosphate Protein I - 5 mg/mL | Initial | 100.0 | 4.4 | 0.0 |
| 1 month | 90.0 | 12.7 | 0.8 | |
| 2 months | 86.6 | 19.8 | 1.8 | |
| 3 months | 71.3 | 22.4 | 2.9 | |
| pH 8 phosphate Protein I - 5 mg/mL | Initial | 100.0 | 4.3 | 0.0 |
| 1 month | 89.9 | 14.6 | 0.0 | |
| 2 months | 69.8 | 20.4 | 4.0 | |
| 3 months | 63.0 | 25.9 | 6.1 | |
| pH 8 (adjusted with NaOH) Protein I - 1 mg/mL | Initial | 100.0 | 2.7 | 0.0 |
| 1 day | 94.5 | 2.0 | 0.1 | |
| 3 days | 101.3 | 2.6 | 0.0 | |
| pH 9 phosphate Protein I - 5 mg/mL | Initial | 100.0 | 5.8 | 0.0 |
| 17 days | 91.5 | 15.6 | 0.0 | |
| 1 month | 82.5 | 21.3 | 0.0 | |
| 2 months | 53.6 | 27.8 | 6.6 | |
| pH 9 (adjusted with NaOH) Protein I - 1 mg/mL | Initial | 100.0 | 3.4 | 0.0 |
| 1 day | 99.0 | 3.1 | 0.0 | |
| 3 days | 98.7 | 3.2 | 0.0 |
| pH | Buffer1 | Time | % Remaining by SEC | % Peak area aggregate species | % Peak area fragment species | Solution Appearance |
|---|---|---|---|---|---|---|
| 5 | Citrate | Initial | 100.0 | 0.8 | 0.0 | Clear |
| 1 week | 29.9 | 2.3 | 5.9 | Precip. | ||
| 2 week | 12.9 | 1.7 | 9.4 | Precip. | ||
| 5.5 | Citrate | Initial | 100.0 | 0.9 | 0.0 | Clear |
| 1 week | 88.9 | 8.9 | 3.9 | Clear | ||
| 2 week | 80.0 | 4.5 | 5.8 | Hazy | ||
| 6 | Citrate | Initial | 100.0 | 1.0 | 0.0 | Clear |
| 1 week | 94.4 | 4.9 | 3.8 | Clear | ||
| 2 week | 90.3 | 5.6 | 5.1 | Slightly Hazy | ||
| 6.5 | Phosphate | Initial | 100.0 | 1.2 | 0.0 | Clear |
| 1 week | 89.1 | 7.3 | 4.6 | Clear | ||
| 2 week | 80.7 | 6.5 | 6.7 | Hazy | ||
| 7 | Phosphate | Initial | 100.0 | 1.4 | 0.0 | Clear |
| 1 week | 87.5 | 6.5 | 4.7 | Clear | ||
| 2 week | 76.6 | 5.1 | 6.7 | Slightly Hazy | ||
| 8 | Phosphate | Initial | 100.0 | 1.9 | 0.0 | Clear |
| 1 week | 57.8 | 9.1 | 6.8 | Precip. | ||
| 2 week | 39.1 | 7.3 | 11.4 | Precip. | ||
| 9 | Tris | Initial | 100.0 | 1.8 | 0.0 | Clear |
| 1 week | 15.7 | 15.9 | 21.6 | Very Hazy | ||
| 2 week | 9.9 | 17.0 | 37.1 | Very Hazy |
|
|
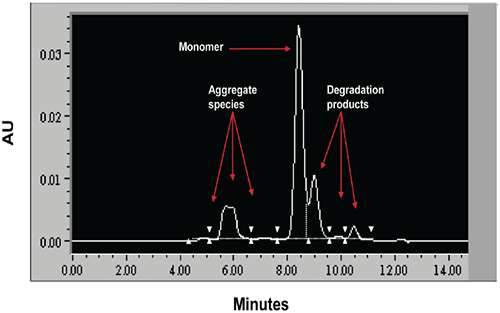
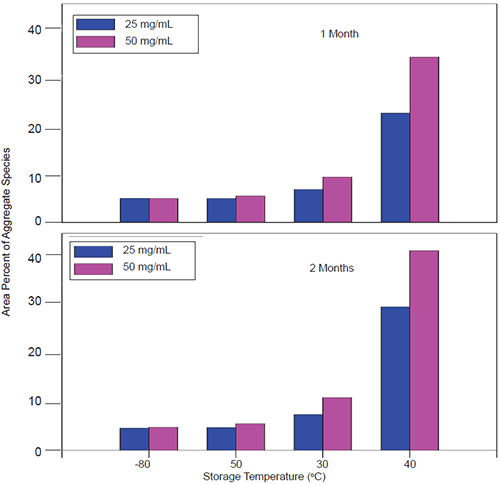
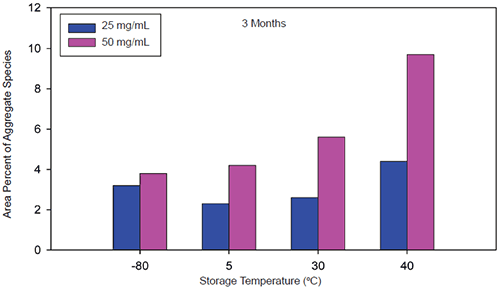
When stressed in solution, both molecules showed a tendency to form multiple aggregate species of varying molecular weight as well as smaller fragmentation products generated by peptide bond hydrolysis. The SEC data indicated that aggregation for both proteins was highly pH-dependent and was the predominant degradation pathway at lower pH. For Protein I, formation of aggregates was maximal at pH 4 but decreased markedly as pH was increased to 7. Peptide bond cleavage to form low molecular weight fragments increased with increasing pH and became most apparent above pH 6. For Protein II, formation of various aggregated species was maximal below pH 5. Smaller amounts of low molecular weight fragments of Protein II were also observed at low pH under accelerated conditions. Similar to Protein I, fragmentation of Protein II to low molecular weight species increased with increasing pH and was most significant at or above pH 8. However, unlike Protein I for which aggregates and degradation products remained in solution, aggregation of Protein II at low pH was followed by rapid precipitation of the protein, suggesting that the process was irreversible. Based on SEC data, the optimal pH conditions for storage of Protein I and Protein II purified bulk are pH 7.5 and 6.0, respectively. Under these pH conditions, aggregation was observed to increase with increasing temperature and concentration for both proteins as shown in Figures 3 and 4.
|
|
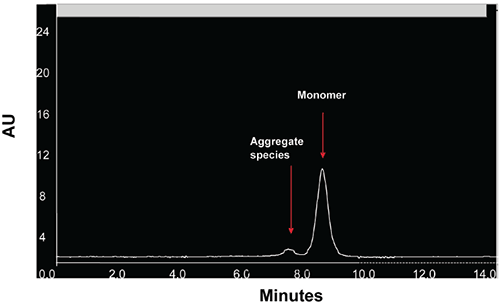
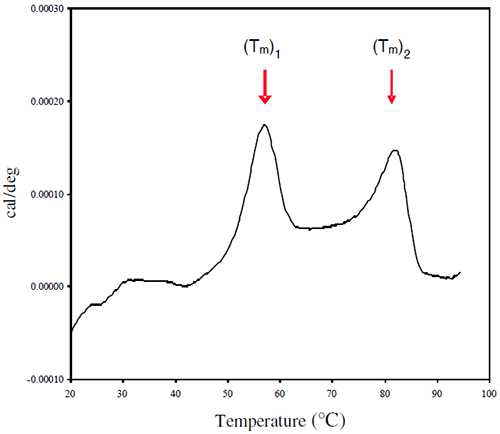
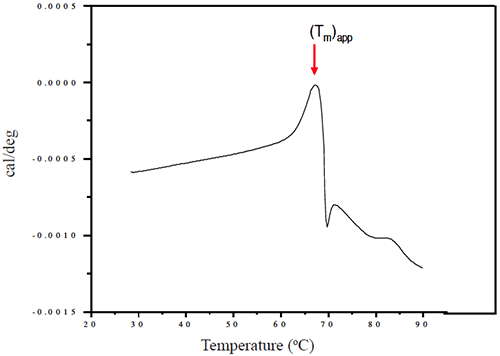
Representative thermograms obtained using a solutions of 1 mg/mL Protein I and Protein II in sodium phosphate buffer (pH 7-7.5) are presented in Figures 5 and 6, respectively.
|
|
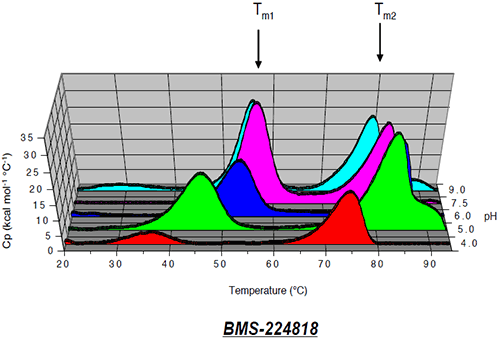
The thermogram for Protein I shows two endothermic transitions Tm1 (left) and Tm2 (right), which may be related to the two domains of the proteins, Fab and Fc. However, because the first transition (Tm1) is likely to be associated with partial unfolding within a particular domain, and the resulting species may show increased susceptibility to aggregation, the first transition was considered to be a more reliable measure of the conformational stability of the native protein. The effect of solution pH on the position of Tm1 is shown in Figure 7.
|
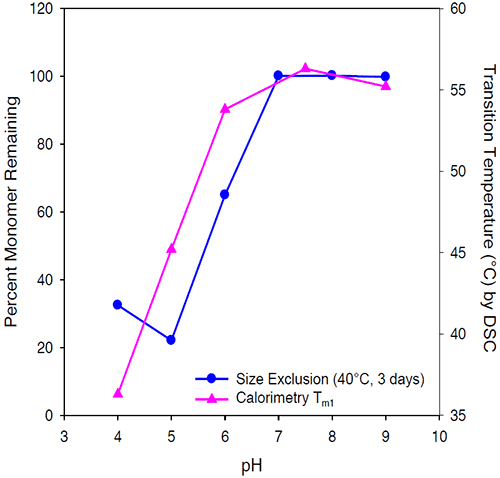
The transition temperature decreases with decreasing pH and is minimal at pH 4. Stabilization of Protein I is reflected in the Tm1 shift to a maximal temperature of 58°C at pH 7.5. The pH of maximal stability predicted by the first transition temperature using microcalorimetry for Protein I was consistent with the pH of maximum stability determined by size exclusion chromatography as shown in Figure 8.
|
As expected, the second transition temperature was less predictive of protein stability, and the results based on second transition temperature were not consistent with the aggregation data by size exclusion chromatography.
At pH 7, the apparent transition midpoint of Protein II, designated as (Tm)app, occurs at approximately 66.5°C and is followed immediately by a sharp exothermic transition, likely to be associated with precipitation of the protein from solution. Similar curve shapes were observed for solutions of Protein II at other pH values. The effect of solution pH on the position of (Tm)app is presented in Figure 9.
|
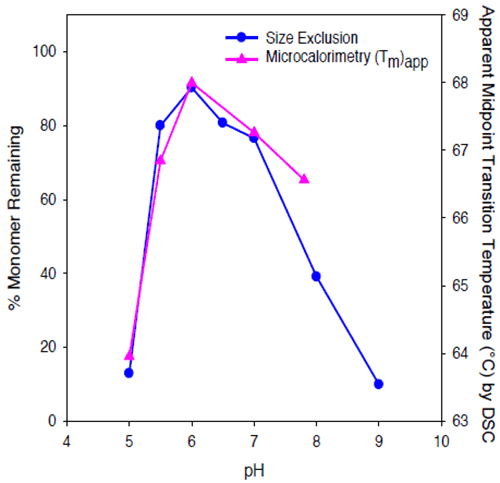
The value of (Tm)app was pH-dependent, and was maximal at pH 6. While some caution should be employed when interpreting (Tm)app values, given that the protein tends to precipitate from solution during the unfolding transition, results of microcalorimetry and accelerated solution stability methods appear to be well correlated for Protein II, both predicting that the pH of maximum stability for the protein is approximately 6 (Figure 10).
|
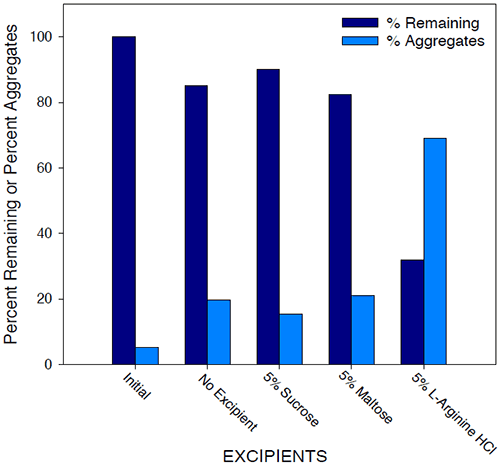
Historically, excipients including sugars, amino acids, polymers, and surfactants have been used as stabilizers in protein formulations. The effect of various additives on solution stability of Protein I was investigated by SEC analysis and microcalorimetry. The results of SEC studies are shown in Figure 11.
|
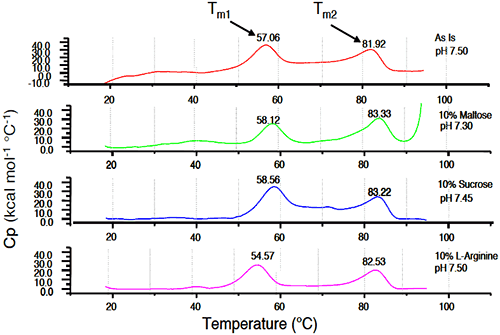
Initial samples of 25 mg/mL Protein I in 25 mM sodium phosphate buffer/10 mM sodium chloride (pH 7.5) were compared to similar samples stressed at 40°C for 2 weeks, with and without additives. While aggregate levels increased for all samples under accelerated temperature conditions compared to initial, amino acids such as L-arginine appeared to further destabilize Protein I in solution, while sugars such as sucrose showed a beneficial effect on stability of the protein. Generally, sugars tend to stabilize the proteins in solution based on the theory of preferential exclusion volume.30 This theory suggests that in the presence of certain excipients, proteins show a greater tendency or “preference” to interact with solvent molecules over the excipient molecules. The protein is, therefore, stabilized in its more compact native conformation such that surface contact with the excipient in solution is minimized. The results of microcalorimetry studies investigating excipient effects on solution stability of Protein I are illustrated in Figure 12.
|
The value of Tm1 was 57.06°C in absence of any excipients. The increase in the Tm1 value was greatest upon addition of sucrose (58.56°C). Maltose also increased Tm1, although to a slightly lesser degree (58.12°C). L-arginine decreased the value of Tm1 (54.57°C), suggesting that this excipient would have a destabilizing effect in solution. Similar to pH stability studies, results of microcalorimetry experiments conducted to evaluate excipient effects on the stability of Protein I were well correlated to those obtained using SEC analysis of accelerated stability samples. Each technique indicated that sucrose increased the stability of Protein I while L-arginine destabilized the protein.
The pH of maximum stability values predicted by microcalorimetry for Protein I and Protein II were pH 7.5 and 6, respectively, and corresponded well with predictions from longer-term solution stability studies for each protein. Based on these studies, the optimal pH conditions for storage of Protein I and Protein II bulk solutions were pH 7.5 and 6, respectively.
The results of these studies suggest that microcalorimetry can be a valuable tool for rapid screening of protein stability in solution, particularly in the early phase of protein characterization and formulation development when bulk supplies are often quite limited. Preliminary information collected using this technique can biomolecules. This can result in significant potential savings in terms of drug substance requirements as well as time and effort spent on sample preparation and complex analysis.