In this application note, we describe the analysis of a semi-purified protein mixture containing β-amylase. Step-by-step, we show how different properties of the proteins elicit a specific response in each detector and how the coupling this data can be qualitatively and quantitatively evaluated.
Whether you are isolating novel proteins for the first time, investigating the aggregation behavior of purified proteins in different conditions or evaluating the success of your conjugation; ultimately you have one thing in common: mixtures! And it is in these situations that you will inevitably be reaching for your chromatography columns. Here, we demonstrate how, in the time taken to run a single chromatogram, significant insights into the composition of sample mixtures can be gained from multi-detection size exclusion chromatography (SEC).
Multi-detection SEC combines column chromatography with viscometer, refractive index (RI), ultra violet (UV) and light scattering detectors to provide a powerful analytical tool that can be incorporated simply and effectively into the workflow of those interested in the analysis of protein mixtures.
In this application note, we describe the analysis of a semi-purified protein mixture containing β-amylase (Figure 1). Step-by-step, we show how different properties of the proteins elicit a specific response in each detector and how the coupling this data can be qualitatively and quantitatively evaluated.
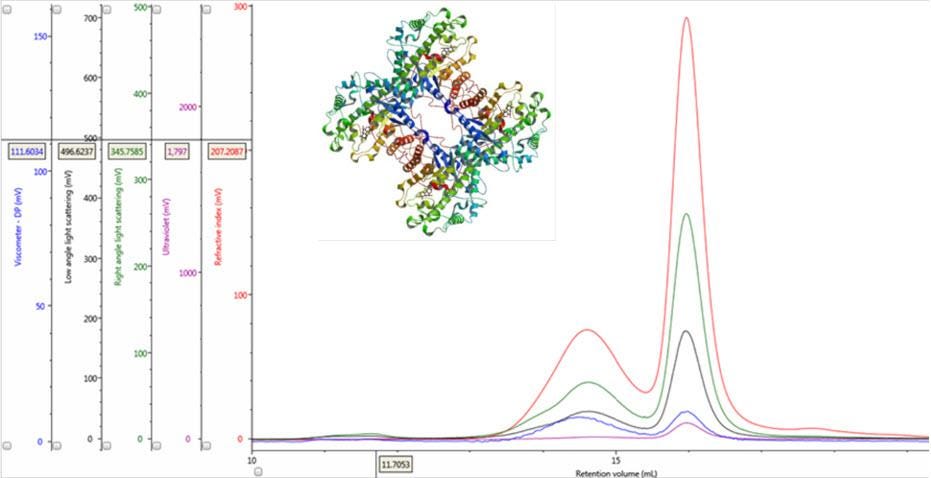
Figure 1: Multi-detector chromatograms of β-amylase from sweet potato (Main); Crystal structure of β-amylase from sweet potato (inset, PDB ID:1fa2).
A semi-purified mixture containing β-amylase from sweet potato (Sigma Aldrich, UK) was solubilized in phosphate buffered saline (pH 7.4) at a concentration of approximately 2 mg/mL and then filtered (cellulose acetate membrane, 0.2 µm). Chromatographic separation of protein mixtures was achieved at a flow rate of 1 mL/min using analytical size exclusion columns (2 x Viscotek P3000, Malvern, UK) and phosphate buffered saline as the mobile phase. Samples, columns and detectors were maintained at 25°C throughout data acquisition. Aliquots of 100 µL were applied onto the columns using the zero waste injection mode. All measurements were performed on a complete OMNISEC system comprising the OMNISEC REVEAL detector module and OMNISEC RESOLVE separations module.
Data obtained from multi-detection SEC holds a wealth of information. Each detector responds to specific properties of the eluting protein molecules and the combination of these responses can be thought of as a fingerprint that is unique and characteristic for each and every protein under analysis. Below we show how these fingerprints can be discerned from a visual assessment of the raw chromatograms and how computational processing of the data support these conclusions.
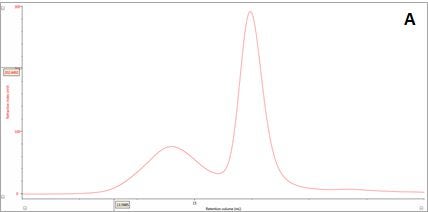
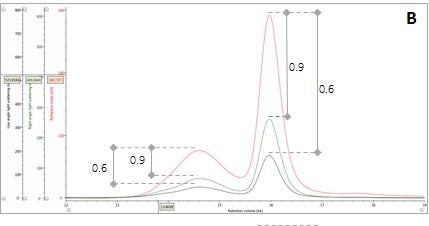
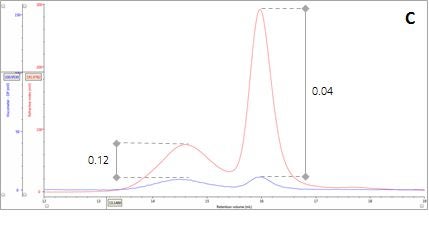
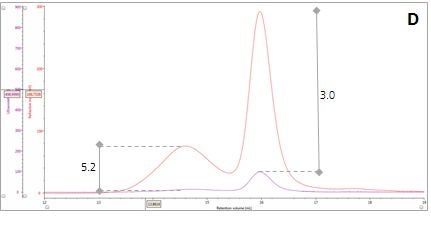
Figure 2: Multi-detector chromatograms: (A) RI response (red), (B) Overlay of RI (red) and light scattering responses (green and black), (C) Overlay of RI (red) and Viscometer responses (blue), (D) Overlay of RI (red) and UV (purple) responses. The peaks in Panels B-D have been annotated with the ratios of RALS to RI, LALS to RI, Viscometer to RI and RI to UV, respectively.
In traditional chromatography the RI detector is used to trace the elution of the sample components through the column. Panel A in Figure 2 shows the RI elution profile of the β-amylase mixture. Here, two main peaks with respective retention volumes (VR) of 14.60 mL (Peak 1) and 15.97 mL (Peak 2) can be clearly discerned. From size exclusion principles, we can deduce that the hydrodynamic properties of the two species are different with the molecules eluting first being of larger hydrodynamic size.
The coupling of a concentration detector with static light scattering detectors allows the determination of molecular weight through the Rayleigh equation. However, a simpler calculation can be applied to raw chromatograms to compare the apparent molecular weight of two different peaks. Simplifying the Rayleigh equation, we can state that the apparent molecular weight of molecules in a peak is proportional to the ratio of light scattering signal to the concentration (LS/C). When applying this to the signals in multi-detection chromatograms, this means that if two proteinaceous peaks have the same LS/C ratio then they must have the same apparent molecular weight. The converse is true for proteinaceous peaks with different LS/C ratios. Figure 2 (Panel B) shows an overlay of RI and light scattering signals. Interestingly, both peaks have the same RALS/C and LALS/C ratios: 0.9 and 0.6, respectively. Therefore, when one considers the simplified Rayleigh assumption, this means that the protein molecules of both populations in this sample have the same apparent molecular weight.
There are two conditions that could explain how this sample could produce chromatograms with peaks of the same molecular weight but temporally distinct VR. The first is that the sample comprises two structurally different species of β-amylase with different hydrodynamic sizes. Alternatively, the sample may comprise two different proteins with the same molecular weight but, again, with different hydrodynamic sizes. An evaluation of the ratio of Viscometer Differential Pressure (DP) and concentration responses (VDP/C) can be used to confirm that these assumptions are validated by the data and are not just artefacts of run conditions or column degradation e.g. voids. Taking the VDP/C ratio from the apex of the peaks (Figure 2, Panel C) gives an approximate intrinsic viscosity value (IV). For this sample, IV for peaks 1 and 2 are 0.12 and 0.04, respectively. Since higher IVs correspond with more open structures, earlier elution for Peak 1 can be rationalized with a larger hydrodynamic size and supports the conclusions drawn thus far.
Insight from the concentration detectors
In order to understand which of the two possibilities, outlined above, best reflect the β-amylase sample, we can turn to the data from the concentration detectors. The RI detector responds to refractive index differences between the mobile phase and the eluting protein molecule; whereas the UV detector responds to the presence of UV absorbing chromophores at a given wavelength. In each case, the magnitude of these signals is directly proportional to the protein concentration; however, the absolute concentration at a given point or under a peak can be determined if the relevant coefficients – dn/dc and dA/dc - for the protein under study are known. A dn/dc value of 0.185 mL/g is typically used for protein measurements; therefore, the determination of concentration using RI is straightforward for most proteins. In the case of UV, however, the dA/dc is protein dependent and is related to the type and number of chromophores in each protein molecule.
Luckily, we can exploit this difference between dn/dc and dA/dc to understand more about our sample mixture. Let’s consider two protein molecules that are compositionally identical but have different hydrodynamic sizes. In this situation, we would expect the ratio between the RI and UV signals (RI/UV) to be the same for both proteins because the dn/dc and dA/dc are equivalent. However, this is not what is observed in our β–amylase mixture; where the RI/UV ratios are 5.2 and 3.0 for Peaks 1 and 2, respectively (Figure 2, Panel D). Since proteins have a fairly consistent dn/dc, the difference in the RI/UV ratios must be attributed to the dA/dc, which ultimately points towards peak 1 being an entirely different protein rather than an aggregate of the β–amylase.
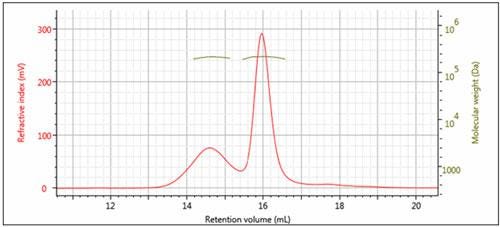
Figure 3: Overlay of multi-detector chromatograms with Mw (left)
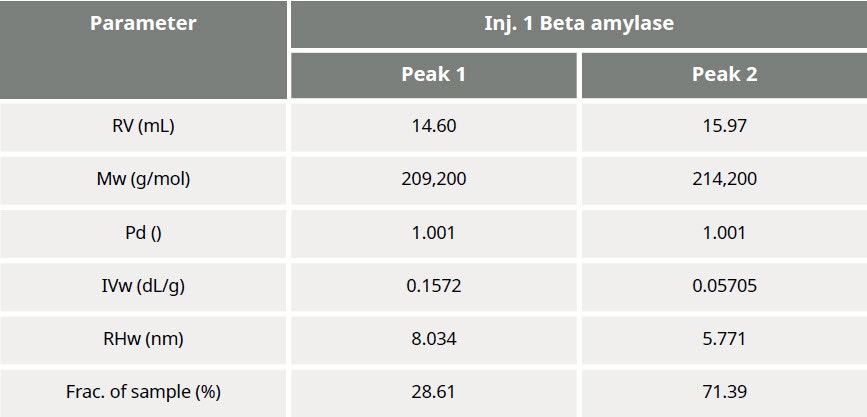
Table 1: Summary of quantitative results obtained from data processing
The results of processing the multi-detection data are summarized in Figure 3 and Table 1. It is clear that the molecular weights of these two peaks are very similar while the hydrodynamic radius (RH) determined for Peak 1 is larger than Peak 2. Using the information from the RI detector, we also deduce that approximately 70% of the sample mixture is Peak 2, while 30% of the mixture is peak 1. Using the UV detector and the molar extinction coefficient for sweet potato β–amylase, we can identify peak 2 as the β–amylase. Peak 1 is therefore identified as the contaminating protein.
In this application note, we analyzed multi-detection data to understand the composition of a semi-pure extract of β-amylase. Where a single detector would have suggested that this sample contains the primary protein and some aggregated material, analysis with multi-detection reveals significantly more information.
The advanced analysis here shows that the secondary peak was not an aggregate but, in fact, an entirely different contaminating protein in the sample. This protein had a molecular weight similar to the β–amylase but its UV response showed it to be a different molecule. The difference in elution volume despite the similar molecular weight is clearly explained by the fact that the two proteins have different structures, as demonstrated by the viscometer. While the β–amylase is a globular protein, the contaminating protein has a much more open, or ‘non-globular’ structure, which gives it a larger size despite its molecular weight.
Although this contaminating protein remains unidentified, the power of multi-detector SEC has allowed us to clearly understand the nature of the two peaks in this chromatogram. It has allowed us to discern that the sample is composed of two different proteins with a similar molecular weight; a conclusion that importantly could not have been made with any one detector alone.
Using advanced, multi-detector SEC systems such as OMNISEC, researchers in the protein field are able to better understand the composition of their protein samples and distinguish aggregates from other contaminants. The extra information provided in such a setup is crucial to fully characterizing and understanding the behavior of such purified proteins when they are used in assays or as biopharmaceutical drugs.