This note shows the use of a PANalytical X’Pert 3
Critical quality parameters like layer thickness and interface roughness could be determined with high accuracy. In addition one of the most important properties of oxide layers on glass -the density - was determined.
The physical properties of glass surface and oxide layers like, for example, anti-reflex coatings mainly determine the properties and quality of the glass. Changes in glass melt during production as well as corrosion of glass surfaces or cleaning and polishing of the glass surfaces are critical processes that determine these properties. X-ray reflectivity is a powerful non-destructive tool to measure the relevant parameters allowing control of the production process.
Far below the critical angle of external total reflection X-rays penetrate only a few nanometers (typically 2 - 5 nm) into condensed matter. Above the critical angle the penetration depth increases rapidly. Grazing incidence X-ray reflectivity (GIXR) measurements are used to analyse sample surfaces and thin layers. GIXR measurements allow to determine densities and thicknesses of layers on substrates and the roughness of external and internal interfaces. Provided the reflectivity is measured over a “wide” angular range (θ approx. 4-5˚) and over at least seven orders of magnitude in reflectivity, a minimum layer thickness in the order of 1 nm and density changes of about 1-2% can be proven under optimal sample conditions (see examples). The method is sufficiently sensitive to provide precise information on the presence of interface layers in layered structures. Figure 1 schematically shows a typical reflectivity measurement and the information contained. The shape of the graph at total reflection - i.e. the “plateau” below the critical angle - is determined by the size of the sample, its flatness and by instrumental parameters (e.g. beam size). The critical angle is determined by the electron density and, with known stochiometric composition, the mass density of the reflecting medium can be derived. The oscillations in reflectivity curves are created by the interference of partially reflected X-ray beams from different depths within the sample corresponding to changes in the electron density. These changes are present at layer interfaces or at the top surface of a coating. The spacing of the oscillations gives therefore information about the different layer thicknesses. In addition the general shape of the curve as well as the amplitudes of the oscillations correspond to surface and interface roughnesses, density fluctuations and the resolution of the instrument.
Figure 1. Reflectivity measurement and information contents

Figure 2. Experimental set-up to measure reflectivity

Our X’Pert3 MRD allows a highly accurate adjustment of the sample with respect to the incident beam and - using an automatic attenuator - the measurement of a large dynamic intensity range. Both instrumental aspects are most important for reflectivity measurements: The measurement of a reflectivity curve is performed using a coupled θ / 2θ scan. Figure 2 shows a typical experimental set-up used for reflectivity measurements in an MRD system. The X-ray source is a sealed tube with copper anode and long-fine focus of optical height 40 mm. The experiments presented were performed with a generator setting of 40 kV / 40 mA.
The programmable divergence slit (PDS) at the incident beam side can be closed to a small opening corresponding to a beam width of less than 0.04° in 2θ. This allows an accurate calibration of the 2θ zero position (direct beam) and an accurate adjustment of the sample with respect to the incident beam. The alignment should be done with an accuracy of approx. 0.001° in order to determine the critical angle θc within a few thousands of a degree. The direct beam intensity was higher than 107 cps. Since the dynamic range of the detector is limited a primary automatic attenuator is used at high intensities. This increases the dynamic intensity range to 7 - 8 decades. The typical background in this set-up is 0.2 - 0.5 cps.
On the diffracted beam side a programmable receiving slit (PRS) and a programmable anti-scatter slit (PASS) are used. They are set into coupled mode - both have the same fixed opening. An additional curved monochromator in front of the detector limits the detected wavelength range and 0.04 rad Soller slits on both sides limit the axial divergence.
The information from the experimental data is extracted with our software for X-ray reflectometry. This program simulates and fits experimental data. It requires the user input of estimates about the instrumental resolution and sample parameters.
Estimates about the coating (number of layers), layer thicknesses, interface roughnesses and information about the compositions and densities (which give start values for δ - the dispersive correction - and β - the absorptive correction -) are used as a starting point for the simulation. Start values for the layer thicknesses can be obtained by a Fourier transformation of the experimental curve. The estimated parameters are used to calculate a simulated reflectivity curve which is then graphically compared with the collected data. The simulation process can be continued by either manually changing the sample parameters or by an automated fit process, which uses the simplex- algorithm and simulated thermal annealing methods.
Figure 3 shows the collected reflectivity data plus the simulated curve for a polished BK7 glass sample (borosilicate glass). The reflectivity was recorded over 7 orders of magnitude in intensity. The graph shows the excellent agreement between simulation and experiment in the region of total reflection and near the critical angle. The high precision in the detection of density changes and absolute density values requires a good sample quality, an accurate adjustment of the sample and a good fit in the region around the critical angle.
The collected data can only be fitted by the assumption of a thin leached layer of 2.4 nm on the glass surface. These layers of lower density (ρ ≈ 2.0 g/cm3) - compared to the bulk glass (ρ = 2.52 g/cm3) - originate from the cleaning process of the glass. The fit values for the roughnesses are σ = 1.0 nm for the leached layer and σ = 1.5 nm for the substrate. These comparably high roughnesses indicate the presence of a graded layer. This example shows that even thin layers with a thickness of only few nanometers can be detected by X-ray reflectometry.
Figure 3. Reflectivity curve of polished BK7 glass and the simulated data

Figure 4. Comparison of ion-plated (IP) and a reactive evaporated (RE) 70 nm thick TiO2 layer on BK7 glass
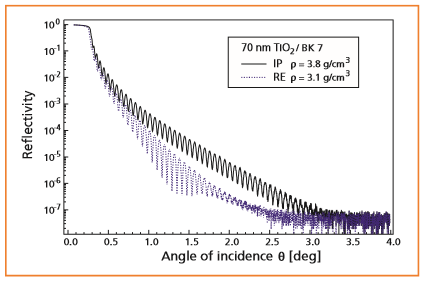
Figure 4 shows the comparison of measurement curves of ion-plated (IP) and reactive evaporated (RE) 70 nm thick TiO2 layers on borosilicate glass (BK7). The data clearly demonstrate that ion-plated TiO2 layers have a much higher density than TiO2 layers produced by reactive evaporation (see critical angle). The simulation for the two different samples provides layer densities of ρ = 3.8 g/cm3 for the ion- plated TiO2 layer and ρ = 3.1 g/cm3 for the reactive evaporated TiO2 layer. In addition the higher surface roughness σ = 1.0 nm) of the RE layer compared to the IP layer (σ = 0.5 nm) becomes visible in the shape of the curve.
Figure 5. Reflectivity curve of a Ta-oxide/Ta multilayer structure on float glass

Table 1. Multilayer data used for fitting the graph in Figure 5

Figure 5 shows that excellent measurements up to high angles (2θ up to 10°) with a high dynamic range (7 decades) are possible using the experimental set-up described above. These conditions are necessary for the simulation of complex multi-layer structures. They allow to collect all important experimental data for a perfect simulation. For a good visibility of the oscillations at high 2θ angles low interface roughnesses of less than 3-4 Å are necessary. The graph shows a measurement of coated float glass. The measurement was simulated with the multi-layer system Ta-oxide / Ta / Ta-oxide / float glass described in Table 1. Oxide layers on both sides of the Ta- layer have to be assumed to allow the fit of the amplitude modulation of the oscillations.
Figures 6 and 7 show the collected and simulated data of a multi-layer system consisting of a 80 nm thick SiO2 layer, a 120 nm thick TiO2 layer and a 60 nm thick layer of SiO2/TiO2 on soda-lime glass. Such multi-layer systems are used in anti-reflex coatings.
Even this complex multi-layer system is fitted with good agreement to the experimental data. It certainly requires good knowledge of the approximate parameters of the sample to achieve good fit results within an acceptable time. To evaluate the data it is necessary to know the order of the layers. The measured graph itself also gives some information about the order of the layers because of the two existing critical angles. This indicates that the SiO2 layer (ρ = 2.0 g/cm3) is above the TiO2 layer (ρ = 3.2 g/cm3). The simulation gives ρ = 2.7 g/cm3 for the density of the SiO2 / TiO2 layer and ρ = 2.5 g/cm3 for the glass substrate.
The simulation also allows a good fit of the fine structure of the oscillations (Figure 7) indicating a good quality of the fit. Remaining differences might be due to inhomogenities in the layers and density gradients at the interface of the layers. X-ray reflectivity performed on a PANalytical X’Pert 3
Figure 6. Reflectivity curve and simulation of an anti-reflection coating on soda-lime glass

Figure 7. Detail of Figure 6

X-ray reflectivity performed on a PANalytical X’Pert 3