
In this study the improved performance of PX10 relative to LiF200 is shown by comparing the measured sensitivities, calculated detection limits and decreased measurement times for the K-lines of elements between potassium and cerium.
For low-level trace element analysis by wavelength dispersive XRF (WDXRF), it is essential to maximize the analyte peak to background ratio and maintain a high spectral resolution to minimize line overlap issues. The most commonly used dispersion or analyzing crystal for the analysis of elements from potassium to uranium is the LiF200 crystal.
For low-level trace element analysis by wavelength dispersive XRF (WDXRF), it is essential to maximize the analyte peak to background ratio and maintain a high spectral resolution to minimize line overlap issues. The most commonly used dispersion or analyzing crystal for the analysis of elements from potassium to uranium is the LiF200 crystal.
Malvern Panalytical’s PX10, a new alternative to LiF200, offers improved analytical performance. In this study the improved performance of PX10 relative to LiF200 is shown by comparing the measured sensitivities, calculated detection limits and decreased measurement times for the K-lines of elements between potassium and cerium.
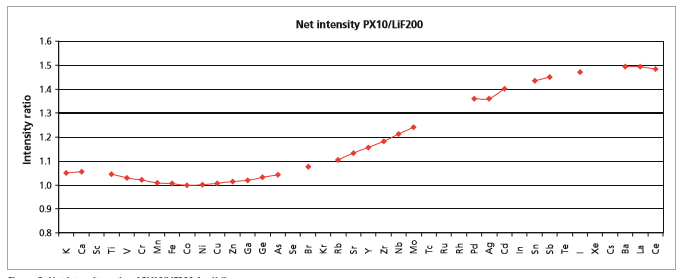
Figure 1 shows scan measurements made on a glass monitor sample with both PX10 and LiF200. The improved sensitivity of the PX10 crystal is clearly shown. Although there is a slight increase in the background signal, this is small when compared to increases observed for total peak intensities. A comparison of net peak intensities (peak minus background) for PX10 and LiF200, calculated for elements between K and Ce, is shown in Figure 2. In the element range between potassium and zinc PX10 has similar net peak intensities to LiF200. However, between arsenic and iodine PX10 net peak intensities rise quickly to 1.5 times that of LiF200.
Improvement in sensitivity by up to 50% make PX10 ideal for the analysis of the heavier elements (e.g. As – Ce), which commonly occur as low-level trace concentrations in a wide variety of sample types.
Figure 1. Comparison between LiF200 and PX10 for Cd and Mo K-lines
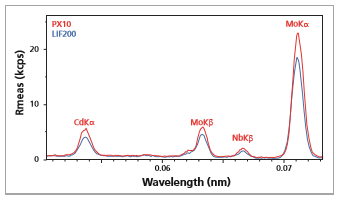
Figure 2. Net intensity ratio of PX10/LiF200 for K-lines
Resolution is an important parameter for trace element analysis, because line overlap on the elements of interest by other elements in the sample adversely affects detection limits.
Normally, intensity and resolution are inversely proportional to one another. However, despite the improvements in intensity the PX10 exhibits a spectral resolution comparable to the LiF200.
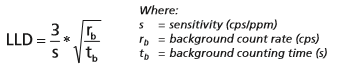
Higher net intensities and improved resolution are also accompanied by higher peak to background ratios. This results in significantly lower detection limits (LLDs) for the PX10. Figure 4 compares the LLDs calculated for measurements made with both PX10 and LiF200, using the following equation:
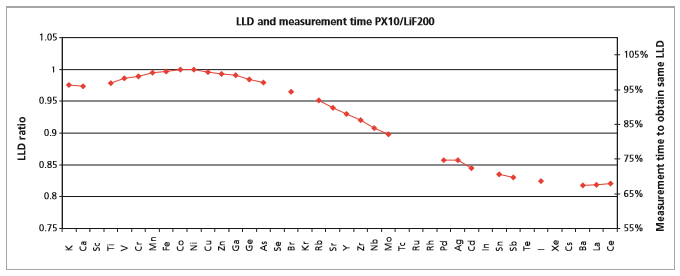
LLDs obtained for the heavier elements with the PX10 are up to 20 % lower than those obtained with LiF200.
Depending on the elements of interest, application measurement times can be reduced by up to 33 % with PX10. This is illustrated in Figure 3, where the time required to obtain the same detections limits as LiF200 is shown.
Figure 3. LLD ratio PX10/LiF200 (left y-axis) and measurement time needed for PX10 to obtain same LLD’s as for LiF200 (right axis)
The PX10 is an excellent upgrade or replacement for LiF200. Net intensities are up to 1.5 times higher than for LiF200 while maintaining the same resolution. This results in better LLD values, particularly for the analysis of heavy elements, and/or a reduction of analysis times by up to 33% to obtain LLDs equivalent to LiF200.