This data sheet demonstrates the performance of the Metals edition of the Zetium XRF spectrometer for the analysis of Al-Mg and Al-Si alloys.
Accurate and fast elemental analysis during the production process of aluminum and its base materials is a critical requirement.
Aluminium is the world’s most abundant metal and is the third most common element comprising 8% of the earth’s crust. The versatility of aluminium makes it the most widely used metal after steel. Pure aluminum is soft, ductile, corrosion-resistant and has a high electrical conductivity. It is widely used for foil and conductor cables, but alloying with other elements, such as Mg and Si, is necessary to provide the higher strengths needed for other applications.
Accurate and fast elemental analysis during the production process of aluminium and its base materials is a critical requirement. This data sheet demonstrates the performance of the Metals edition of the Zetium XRF spectrometer for the analysis of Al-Mg and Al-Si alloys.
The Metals edition of the Zetium spectrometer is a fully integrated wavelength dispersive XRF spectrometer, including an X-Y sample handler and SuperQ analysis software. The default configuration of the Metals edition of the Zetium contains the analysis crystals PE002, Ge111, LiF200 and LiF220. For improved resolution and intensity for Si analysis, the PE002 crystal was upgraded to a PE002-curved crystal and a PX8 multilayer crystal was added for high-resolution analysis of Mg.
All elements were measured using a 300 μm collimator except Mg, for which a 700 μm collimator was used. The tube settings varied between 24 kV / 100 mA (for Mg and Si), 40 kV / 60 mA (for Ti) and 60 kV / 40 mA (for Mn, Fe, Cu, Ni and Zn). The samples were measured using a 27 mm collimator mask. The total measurement time was 64 seconds. Matrix corrections were made using the SuperQ FP algorithm.
The application was set up using 2 sets of certified reference materials (CRM), one for Al-Si alloys (CKD 236 – 241) and one for Al-Mg alloys (CKD 242 – 246). The samples were resurfaced on a Herzog lathe before measurement.
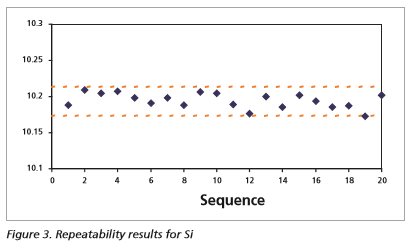
Calibration curves for Mg and Si are shown in Figures 1 and 2 and the calibration details for all elements are given in Table 1.
The accuracies of the calibrations are indicated by the RMS (absolute error) and the K-value (weighted error).
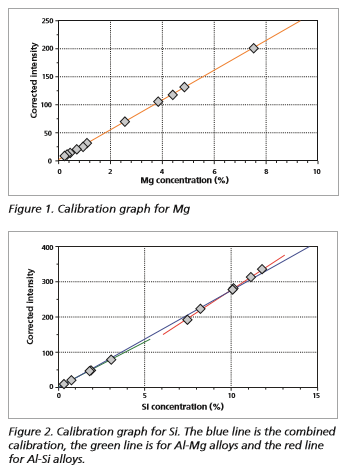
Since the K-value is independent of the calibrated concentration range (unlike the RMS value) it gives a more reliable indication of calibration quality. As a rule of thumb K-values of 0.02 – 0.03 are indicative of good calibrations.
Accurate calibrations are obtained for all elements except Si and Zn, for which relatively high K-values are observed (0.085 and 0.044, respectively). It is well known that metallic structure and element distribution along grain boundaries can vary from one alloy type to another. These metallurgical differences affect some elements more than others and may be such that different alloy types require separate calibrations for the most strongly affected elements. This is clearly seen for Si in Figure 2. The calibration accuracy is significantly improved if separate low (Al-Mg alloy) and high (Al-Si alloy) range calibrations are specified (Table 1). Using the Automatic Program Selection (APS) feature of the SuperQ software the correct calibration can be selected automatically at the time of measurement.
| Element | Concentration range (wt%) | K-factor | RMS (wt%) | LLD (ppm, 100s) |
|---|---|---|---|---|
| Mg | 0.2 - 7.5 | 0.022 | 0.032 | 4.4 |
| Si | 0.3 - 11.8 | 0.085 | 0.230 | 3.1 |
| Low Si (Al-Mg alloys) | 0.3 - 3.1 | 0.014 | 0.019 | |
| High Si (Al-Si alloys) | 7.5 - 11.8 | 0.031 | 0.090 | |
| Ti | 0 - 0.23 | 0.007 | 0.003 | 0.9 |
| Mn | 0 - 0.85 | 0.009 | 0.007 | 0.4 |
| Fe | 0 - 1.14 | 0.016 | 0.014 | 0.5 |
| Cu | 0 - 1.51 | 0.023 | 0.015 | 0.6 |
| Ni | 0 - 1.65 | 0.017 | 0.018 | 0.3 |
| Zn | 0 - 1.14 | 0.044 | 0.021 | 0.5 |
| Table 1: Calibration details | ||||
The accuracy of the method was verified by measuring a CRM as a routine sample. The results for the CRM CKD 244, an Al-Mg alloy, are given in Table 2. For all elements the measured values are very close to the certified values, except for Zn where the difference is significant. This difference is a consequence of the metallurgical differences between the two alloy types, and can be rectified by using APS to select an alloy-specific calibration for Zn.
| Element | Certified (wt%) | Measured (wt%) |
|---|---|---|
| Mg | 4.84 | 4.84 |
| Si | 0.78 | 0.79 |
| Ti | 0.005 | 0.006 |
| Mn | 0.185 | 0.184 |
| Fe | 0.14 | 0.13 |
| Cu | 0.08 | 0.07 |
| Ni | - | 0.01 |
| Zn | 0.05 | 0.08 |
| Table 2: Accuracy results for Mg-Al alloy CKD 244 | ||
To test the precision of the method and the instrument, one sample was measured 20 times consecutively. The results are presented in Table 3 and a graphical representation for Siis shown in Figure 3. Relative errors are well below 1% for almost all elements, indicating a very good repeatability and instrument stability. Comparison of the absolute RMS values with the CSE values (theoretically the minimum possible error) shows the same value for all elements, which means that this is the lowest error possible for a repeat measurement under these conditions.
| Element | Mg | Si | Ti | Mn | Fe | Cu | Ni | Zn |
|---|---|---|---|---|---|---|---|---|
| Average (wt%) | 0.65 | 10.19 | 0.073 | 0.27 | 0.45 | 0.69 | 0.91 | 0.045 |
| RMS (wt%) | 0.003 | 0.01 | 0.001 | 0.001 | 0.002 | 0.002 | 0.002 | 0.0003 |
| RMS (rel%) | 0.44 | 0.10 | 1.04 | 0.49 | 0.41 | 0.25 | 0.24 | 0.60 |
| CSE (wt%) | 0.003 | 0.01 | 0.001 | 0.001 | 0.002 | 0.002 | 0.002 | 0.0003 |
| Table 3: Repeatability results (20 consecutive times) for Si-Al alloy CKD 240 | ||||||||
This data sheet demonstrates the capability of the Metals edition of the Zetium spectrometer for a fast and accurate analysis of Al alloy. The results are accurate and precise, which make the Zetium Metals edition a perfect instrument for the process control of aluminium alloys. For more accurate analysis of different types of Al alloys, separate calibration lines can be made for each alloy type. The selection of the appropriate calibration can be done automatically by using the APS option in SuperQ.