The repeatability results illustrate the stability and robustness of the Epsilon 4. The combination of excellent detector resolution, high sensitivity and powerful software deconvolution models contribute to the accuracy and precision of the results. The non-destructive nature of the method makes it possible to measure the samples subsequently by other analytical techniques, if required.
This application note shows the capabilities of the Epsilon 4, a benchtop energy dispersive X-ray fluorescence spectrometer (EDXRF) to analyze elemental impurities according to USP <232> and ICH Q3D, following USP <735> guidelines.
The introduction of USP <232> and ICHQ3D has required the pharmaceutical industry to re-evaluate how elemental impurity (heavy metal) analysis is performed. USP <735> and EP 2.2.37. enable the use of X-ray fluorescence spectrometry for this analysis.
Measurements were performed using an Epsilon 4 EDXRF spectrometer, equipped with a 15 W, 50 kV silver anode X-ray tube, 6 beam filters, a helium purge facility, a high-resolution Silicon Drift Detector SDD30, a sample spinner and a 10-position removable sample changer.
Loose powder samples (100 mg) were weighed into a small mass holder and assembled using 6 µm polypropylene supporting films.
In-house cellulose calibration standards containing Cd, Pb, As, Hg, Co, V, Ni, Tl, Pd, Ir, Rh, Ru, Se, Pt, Mo, Cu, and Cr were used to set up the calibration. The concentrations of the elements in the standards were verified by ICP-MS. Three different measurement conditions were used, each one optimizing the excitation of a group of elements (Table 1). The analyses were performed in air atmosphere with a total measurement time of 1 hour per sample. The time can be adjusted depending on the elements of interest. The intensities were calculated using a deconvolution method. An example spectrum for measuring condition 2 is given in Figure 1.
Figure 1. Zoomed spectrum of Ru, Rh, and Pd from condition 2.
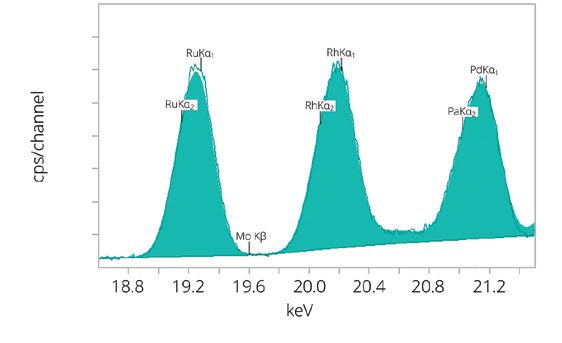
Table 1. Measurement conditions
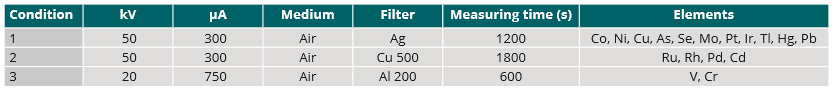
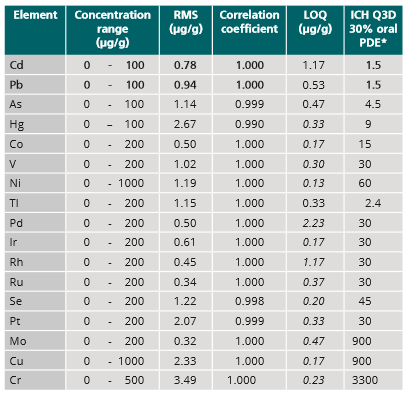
Figure 2 shows the calibration plots for Cd in the cellulose standards. The calibration plot demonstrates an excellent correlation between the chemical concentrations obtained by ICP-MS and the measured intensities. Table 2 summarizes the calibration data for all elements in the cellulose standards. The LOQ values in Table 2 are calculated by taking 10 times the standard deviation from 20 measurements of a blank standard. The ICH Q3D guideline stipulates a control threshold of 30% of the Permitted Daily Exposure (PDE) where additional controls may be required if the concentration exceeds the control threshold. For all elements, the LOQ is smaller than the required threshold of 30% of the PDE, based on 1 g daily dose. All italic printed LOQ values also comply with a 10 g daily dose.
Figure 2. Calibration graph for Cd in 100 mg loose cellulose powders
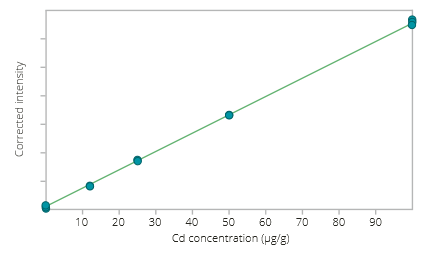
Table 2. Calibration details
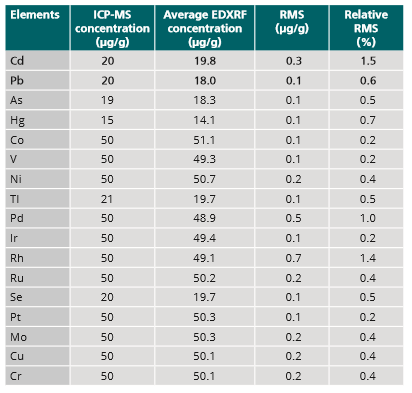
To test the repeatability of the Epsilon 4 instrument, a check standard was measured 5 times consecutively. The average concentration, RMS and the relative RMS of the repeat measurements for all the elements are presented in Table 3. Apart from Cd, Rh and Pd, the relative RMS values are well below 1 %.
Table 3. Results of the repeatability test of the check standard
The data presented in this application note clearly demonstrate that the Epsilon 4 EDXRF spectrometer can measure elemental impurities at the levels required by ICH Q3D and USP <232> using only 100 mg of sample. The EDXRF data compares favorably with ICP data. The repeatability results illustrate the stability and robustness of the Epsilon 4. The combination of excellent detector resolution, high sensitivity and powerful software deconvolution models contribute to the accuracy and precision of the results. The non-destructive nature of the method makes it possible to measure the samples subsequently by other analytical techniques, if required.