Light scattering techniques are widely used for the characterization of solutions of polymers and macromolecules.
Dynamic light scattering (also know as photon correlation spectroscopy (PCS) and quasi-elastic light scattering (QELS)) measures the time-dependent fluctuations in the intensity of scattered light that occurs because the particles are undergoing Brownian motion. The velocity of this Brownian motion is measured and is called the translational diffusion coefficient D. This diffusion coefficient can be converted into particle size using the Stokes-Einstein equation.
Polymers are used in a wide variety of applications due to their diversity of properties. The molecular structure, conformation and orientation of the polymer molecules can greatly affect the macroscopic properties of the material.
Random coil polymer molecules have open conformations. This results in low refractive index differences with the continuous phase and as a result they scatter very little light. For such weakly scattering samples, the intensity of scattering observed using conventional DLS instruments (i.e. 90° detection) may not be sufficient for successful sizing measurements to be performed.
The Zetasizer Nano range of instruments incorporates non-invasive back scatter (NIBS™) optics. The scattered light is detected at an angle of 173°. The novel optics arrangement maximizes the detection of scattered light while maintaining signal quality. This provides the exceptional sensitivity that is required for measuring the size of molecules smaller than 1000 Daltons.
This application note summarizes measurements made on various polymers in solution using the Zetasizer Nano S. The Nano S contains a 4mW He-Ne laser operating at a wavelength of 633nm and an avalanche photodiode (APD) detector.
Even though absolute molecular weight measurements are obtained using static light scattering, molecular weight can sometimes be inferred from DLS measurements by exploiting the Mark-Houwink relationship that defines the intrinsic viscosity of a polymer solution in terms of the molecular weight of the solute.
This turns out to be closely related to the translational diffusion coefficient (D) of the molecules in the following equation:
D = kM-αWhere k is a constant for a particular polymer in a solvent, M is the molecular weight of the solute and a is a conformational parameter describing the compactness of the molecule in solution. A measured value for a of 1 suggests that the solute molecules are rigid rods; a value of 0.5 to 0.67 is obtained with random coils and a value of 0.3 occurs for spheres. Therefore, it is possible to obtain information regarding the conformation of a solute molecule in a particular solvent from DLS measurements.
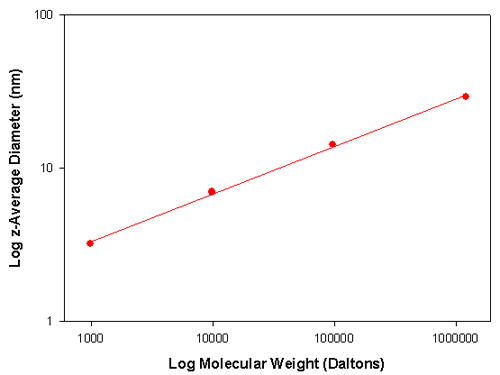
Table 1 summarizes DLS sizing measurements performed on a number of polystyrene samples of various molecular weights dissolved in toluene. The z-average diameter is the mean diameter based on the intensity of scattered light.
| Polystyrene Molecular Weight (Daltons) | z-Average Diameter (nm) |
|---|---|
| 980 | 3.2 |
| 9,860 | 7.0 |
| 96,000 | 14.2 |
| 1,214,000 | 29.2 |
Taking logs of the equation D = kMα , the following expression is obtained;
Log D = Log k - α Log M
Therefore a graph of Log D versus Log M will give a plot whose slope is α. The translational diffusion coefficient, D, is related to particle size through the Stoke-Einstein equation. Therefore, a plot of Log particle size versus Log M also allows determination of the value of a. Figure 1 shows such a plot for the data contained in table 1. The slope of the line is 0.31 indicating that the polystyrene molecules have adopted a spherical conformation in toluene.

|
Poly(N-isopropylacrylamide) (PNIPAM) is one of the most well known polymers that exhibits a reversible, temperature-dependent phase transition [1-3]. The temperature at which this occurs is known as the cloud point or lower critical solution temperature (LCST). PNIPAM is soluble at temperatures below the LCST and the polymer has a random coil conformation. At temperatures above the LCST, the polymer chains collapse into a globule. This sharp transition is attributed to alterations in the hydrogen bonding of water molecules to the amide group of the side chain [3,4].
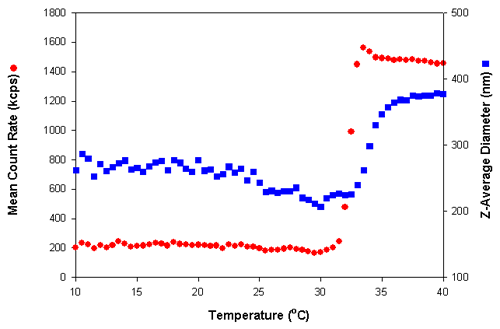
Figure 2 shows the results obtained from a temperature scan of a sample of PNIPAM prepared in deionized water at a 0.01% w/v concentration. Measurements were made at 0.5°C intervals using a temperature range of 10 to 40°C. A delay time of 5 minutes was used at each temperature to ensure that the sample viscosity was equilibrated before the measurements were taken. Both the mean count rate (in kilo counts per second (kcps)) and z-average diameter (nm) are plotted as a function of temperature (°C).

|
The large increase in the mean count rate at a temperature of 32°C is consistent with previously published LCST values for PNIPAM [3]. This increase in the scattered light results from a change in the refractive index of the PNIPAM molecules as they undergo a transition from random coil to condensed globule. The refractive index of the condensed globule structure is higher than that of the random coil polymer.
Figure 3 shows the intensity size distributions obtained at (a) 10°C and (b) 40°C. When the PNIPAM molecules are in a random coil configuration, the size distribution is broader compared to when the polymer is in a condensed globule. The polydispersity index values obtained at these two temperatures are 0.491 and 0.087 respectively. The lower value of 0.087 confirms the narrower size distribution seen at 40°C.

|
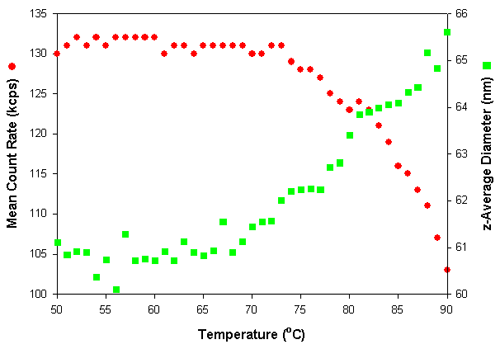
Dynamic light scattering can easily monitor temperature dependent changes in the conformation of polymer particles. Figure 4 shows the effect on the mean count rate and z-average diameter of a polymer particle dispersion as the temperature was increased. The measurements were made at 1°C intervals with an equilibration time of 5 minutes at each temperature.

|
The z-average diameter increases with increasing temperature. Normally, an increase in the z-average diameter is an indication of particle aggregation. This would also result in an increase in the mean count rate. However, in the results obtained in this study, the mean count rates decrease upon heating. Therefore, the increase in the mean diameter indicates that the polymer particles are swelling with increasing temperature. As the conformation of these swollen particles becomes more open with increasing temperature, the refractive index of particles decreases with a resultant decrease in the mean count rate.
The Zetasizer Nano series with NIBS™ optics allows for study of very small, weakly scattering particles such as polymers at low concentrations. The Nano software allows for the easy setup of temperature versus size and intensity measurements with full control over equilibration times. Monitoring both mean count rate and particle size as a function of temperature elicits information on changes in polymer conformation and helps to understand what processes are occurring.
[1] Schild, H.G. (1992) Prog. Poly. Sci. 17, 163-249.
[2] Wu, C. and Zhou, S. (1996) Phys. Review Lett. 77, 3053-3055.
[3] Ottaviani, M.F., Winnik, F.M., Bossmann, S.H. and Turro, N.J. (2001) Helv. Chim. Acta 84, 2476-2492.
[4] Wu, C. and Wang, X. (1998) Phys. Rev. Lett. 80, 4092.