In this application study, one half of a small shell was investigated in detail to explore its shape, mineral composition and special features. The example demonstrates the powerful combination of X-ray diffraction, X-ray imaging and Computed Tomography.
With X-ray Computed Tomography(CT), a full 3D image of samples can be obtained non-invasively, allowing visualization and analysis of the full 3D microstructure.
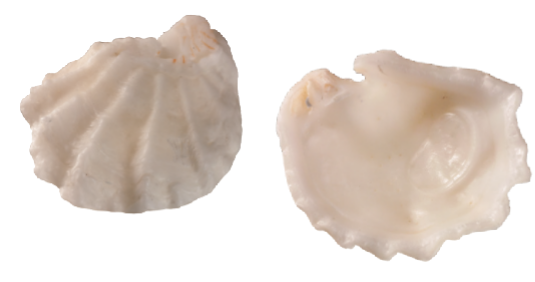
Figure 1. Outer (left) and inner (right) part of the shell half
With X-ray Computed Tomography (CT), a full 3D image of samples can be obtained non-invasively, allowing visualization and analysis of the full 3D microstructure. The contrast in CT images is based on the difference in absorption of X-rays by the constituents of the sample: projections of the X-ray beam through an object from many different angles are created. As the X-rays pass through the object, some radiation is absorbed, some is scattered and some is transmitted. The radiation transmitted through the object at each angle is measured and the data is stored as 2D X-ray images.
The series of these 2D X-ray projections is then used to generate a 3D image by numerical reconstruction of the volumetric data (volume rendering). This reconstructed volume data represents 3D microscopy, where the very fine scale internal structure of objects is imaged non-destructively. No sample preparation or thin slicing is required - a single scan images the sample’s complete internal 3D structure at high resolution. By combining phase analysis with density and microstructure information a complete picture of the sample is obtained. Results can be correlated with macroscopic material properties.
Measurements were performed on a Malvern Panalytical Empyrean Theta-Theta diffractometer system. The system was equipped with a Cu LFF X-ray tube (used in point focus) and a PIXcel3D detector. The micro-diffraction experiments have been performed with a micro-diffraction stage and a 0.5 mm monocapillary optic or double crossed-slit collimator on the incident beam side. For some of the 2D experiments the PIXcel3D detector was placed on a radius reduction interface to increase the capture angle. For the CT measurements the CT rotational stage was mounted on the system.
A CT measurement of the shell was made by collecting 2D radiographs taken during a full rotation of the sample (Figures 2 and 3). A 2D projection image (radiograph) shows uneven wall thickness and spotty tracks of very thin mineralized areas.
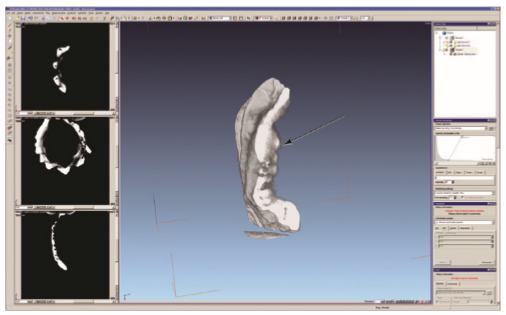
The 3D image of the shell half (Figure 3) allows us to analyze the details of the shell microstructure, including the differences in wall thickness and traces of possible weathering. CT imaging allows detailed viewing of the internal structure of the object through 2-dimensional slices. A 2D transverse slice through the shell clearly shows the protruding base (the myophore plate) inside the shell at the anterior part, which once formed the base for the adductor muscles for shell closure (Figure 4).
Figure 2. Radiograph (2D - image): the light-colored spots represent more transparent (meaning less absorbing) areas, in this case, thinner parts of the shell.
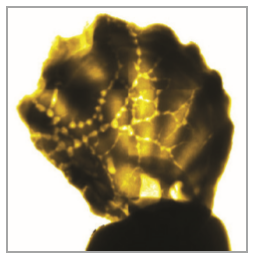
Figure 3. CT reconstruction of the shell
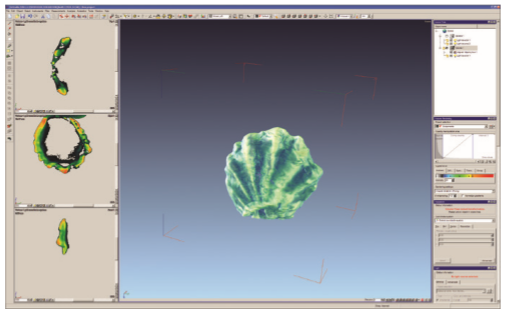
Figure 4. The transverse slice of the CT image shows the protruding base of the adductor muscle (arrow)
Standard 1D X-ray micro-diffraction on the outer (“prismatic”) layer (measurement position marked with red spot in Figure 5) confirms its composition as calcite (rhombohedral CaCO3), whereas the inner (“nacreous”) layer consists of aragonite (orthorhombic CaCO3) - (measurement position marked with blue and green spot in Figure 5).
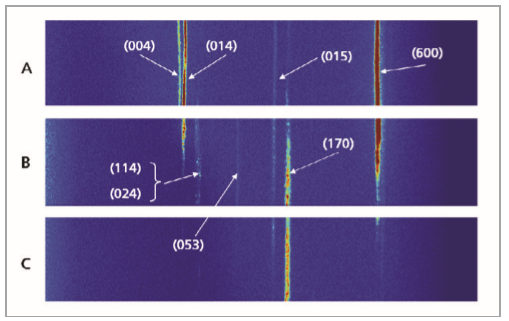
Studying the aragonite layer on the inside in more detail reveals interesting differences in its crystallization history. Spot measurements with a 0.5 mm monocapillary optic on different areas of the inner part demonstrate the occurrence of distinct preferred orientation in the aragonite crystallized in the muscle base. Aragonite in the rest of the inner shell shows much less preferred orientation (Figure 6). A complete texture analysis on the muscle base at the inside of the shell is not possible due to the shell's concave shape. This causes shadowing effects below 60 degrees 2theta for some orientations. Therefore, the preferred crystal growth of aragonite at the muscle base has been studied in more detail with 2D scans of the base position under different orientations. The PIXcel3D detector was placed on a radius reduction interface to increase the active capture angle of the detector to approximately 14.5 degrees. Such a study can highlight specifics of selectively orientated crystallization of materials, even on small spots of irregularly shaped objects (Figure 8).
Figure 5. Indication of the micro-diffraction measurement spots. Red: measurement spot at the outside of the shell, blue and green: measurement spots at the inside of the shell (green spot on the muscle base).
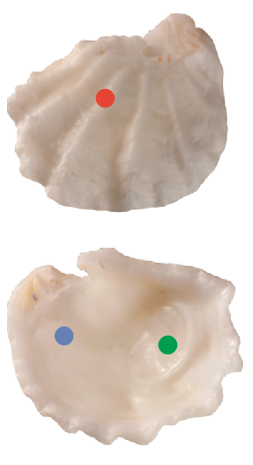
Figure 6. Micro-diffraction measurement results at the spots indicated in the photographs of Figure 5. Red: measurement at the outside of the shell, blue and green: measurements at the inside of the shell (green spot on the muscle base).
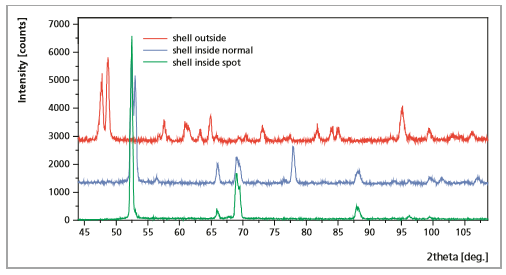
Figure 7. Indication of the diffraction directions during the 2D scans
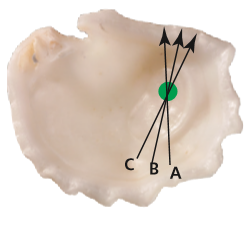
Figure 8. 2D scans in different orientations of the muscle base show distinct oriented crystallization patterns of aragonite (the 2D scans correspond to the directions as indicated in Figure 7)
The possibility to combine CT and XRD on one instrument allows to easily correlate micro-structure information of a sample with the analysis of its phase composition, phase distribution and preferred crystal orientation giving a more complete picture of the sample.