The ability to measure accurate particle size across a range of concentrations and sizes whilst maintaining consistent results is critically important in ensuring you can trust your data and develop an understanding of your application. This paper helps describe the differences between backscatter and NIBS and explains the unique functionality that NIBS provides.
The market-leading Zetasizer Nano featuring NIBS technology ensures:
The ability to measure accurate particle size across a range of concentrations and sizes whilst maintaining consistent results is critically important in ensuring you can trust your data and develop an understanding of your application. The Zetasizer Nano delivers this above any other commercially available DLS instrument, through the use of Non-Invasive BackScatter (NIBS) technology.
NIBS is one of the key features that makes the Zetasizer best-in-class, enabling the ultimate in instrument flexibility. The patented NIBS technology [1] maximizes the dynamic range without compromise; provides the highest sensitivity while handling the most concentrated samples; measures the smallest particles as well as the largest. This unique ability to perform at the highest level no matter the application has resulted in the Zetasizer Nano being the most popular instrument for sizing by DLS, with over 50,000 peer-reviewed publications.
This paper helps describe the differences between backscatter and NIBS and explains the unique functionality that NIBS provides.
Dynamic Light Scattering (DLS) is a powerful analytical tool which provides particle size measurement across a broad range of particle sizes. Traditionally 90° detection angles were employed, which can operate to a maximum size range of ~0.3 nm to ~6 µm. The sensitivity of these systems could be increased by inserting a laser of higher power, however this would have a negative impact on stability, reproducibility and lifetime of the system. By using a backscatter angle the following advantages are achieved:
The benefits of backscatter can come with compromises:
These are overcome in the Zetasizer Nano using NIBS. For aggregate detection, a forward angle is the most sensitive. Therefore, a 13o angle is employed to detect the presence of aggregates at much lower concentrations than backscatter or 90o.
The introduction of Non-Invasive Back Scatter (NIBS) by Malvern Instruments not only provided the advantages of backscatter but critically applied these to a broad dynamic range of concentrations, which remains a unique feature to Malvern. NIBS uses a detection angle of 173° and automatically determines the optimum measurement position within the cuvette and correct attenuation of the laser for the sample being measured. In addition, NIBS uses the latest in fiber optic technology to ensure efficient signal collection and high detection sensitivity without the need for a high power laser source. These features make NIBS unique, providing extremely useful functionality unavailable on other instruments (even those using back scatter detection).
At one extreme, for example, when analyzing very low concentrations or weakly scattering particles that require maximum sensitivity, NIBS automatically positions the 173o detector optics at the center of the cell to maximize the scattering volume. As the concentration or scattering intensity increases, the software automatically determines the optimum response, whilst avoiding multiple scattering, by moving the optics across the cell in small increments. At the other extreme of maximum concentration the optics will be positioned at the cell wall, reducing the path length and therefore minimizing multiple scattering, Figure 1. It is important to note that the other component that is automatically adjusted to help optimize data quality is the attenuator. There are 11 positions of attenuation to ensure the optimum amount of light is used, which is combined with the 6 measurement positions to ensure that no matter what the concentration, size and scattering efficiency, the optimal results are reached with a potential 66 combinations covering the broadest range of applications. This technology is why Malvern offers an instrument with a much greater dynamic range and data quality than any other instrument on the market.
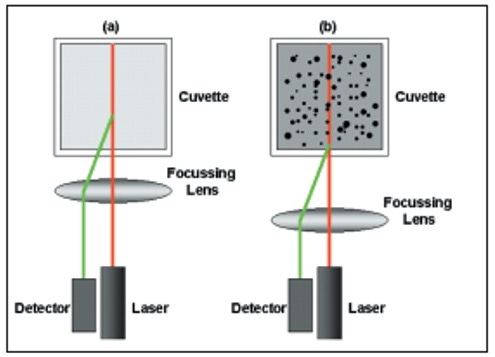
Figure 1: A schematic of the measurement position for (a) weakly scattering or low concentration samples and (b) concentrated or strongly scattering samples
In recent years, other manufacturers of DLS instruments have also introduced backscatter measurements due to the potential benefits they bring. These instruments however, do not have the ability to operate in NIBS mode (i.e. vary path length according to sample characteristics), but rather employ a more simplistic methodology of using fixed measurement positions. The major advantage of NIBS with its automatic attenuation and optimization of the measurement position is that samples covering a wide range of sizes and concentrations can be measured at a single angle. In instruments which use backscatter detection but do not optimize the measurement position, the restrictions imposed from backscatter are too great, with serious limitations on the performance and versatility of the system. This has enforced an implementation of using a combination of 90o and backscatter. This has some profound consequences on the data provided by the instrument as Mie scattered light has an angular dependency, as can be seen in Figure 2.
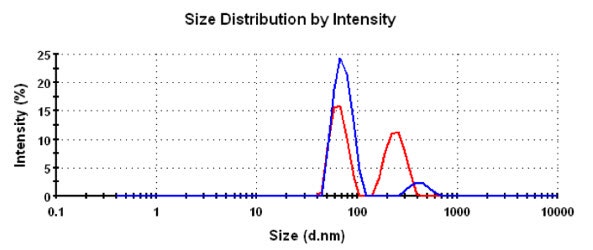
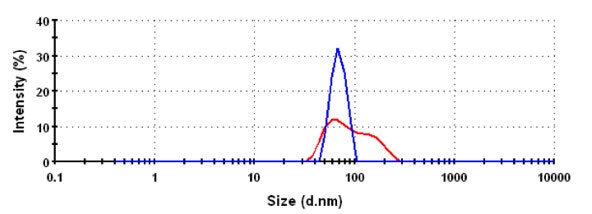
Figure 2: Intensity size distributions for backscatter (blue) and 90 (red) of 60:220nm latex standards at a ratio of (a) 23:1 and (b) 40:1
One alternative implementation of backscattering to work at higher concentrations involves focusing the measurement near the cuvette wall for concentrated samples to reduce multiple-scattering, and for more dilute or weakly scattering samples, the 90o measurement is employed in the center of the cuvette. The instrument swaps between these measurement positions as sample concentration varies. Therefore by changing concentration of the sample, the angle the measurement is performed at also changes, the consequence of which is a shift in results. Using the example in Figure 2, at low concentration the red trace will be obtained, as the concentration increases the results will suddenly change to the blue trace.
Another implementation utilizes the backscatter to improve sensitivity, to help with the analysis of more dilute samples or weaker scattering samples, such as proteins. In this case, the measurement is focused in the center of the cell to increase measurement volume, then for more concentrated, or strongly scattering samples, the 90o measurement is employed, also in the center of the cuvette. The instrument swaps between these measurement positions as sample concentration varies. Therefore, just as in the previous situation, by changing concentration of the sample you change which angle you measure it at, changing the value obtained. Using the example in Figure 2, at low concentration the blue trace will be obtained, and as the concentration increases the results will suddenly change to the red trace. As both measurements are taken in the center of the cell, this configuration has a very restricted higher concentration limit due to multiple scattering.
Neither of these methodologies offer the same advantages as NIBS measurement by Malvern Instruments, due to the limitations of this more simplistic implementation. When utilizing the NIBS technology, the angle remains the same no matter what the sample conditions, therefore a consistent result is obtained. This section illustrates the expanded concentration range of NIBS by measuring a NIST traceable polystyrene latex standard (200 nm) at a wide range of concentrations. It also compares the results obtained using NIBS with other measurement setups. Results for the different measurement setups used for the 200nm Thermo Scientific polystyrene latex standard measured at various concentrations from neat (1%) to 1 x 10⁻⁵% w/v are shown in Figure 3.
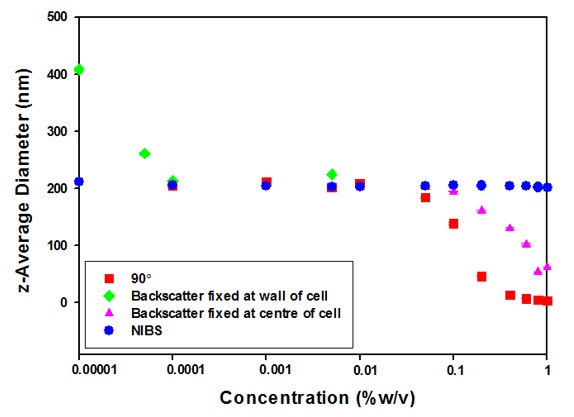
Figure 3: A summary plot of the z-average diameters (in nanometres) obtained for various concentrations of a Thermo Scientific 200nm polystyrene latex standard measured using (1) NIBS, (2) backscatter detection fixed at the center of the cell, (3) backscatter detection fixed at the wall of the cell and (4) at a 90° detection angle.
As can be seen, when the sample measurement is optimized (using NIBS) a straight graph of particle size versus concentration can be achieved, from neat to the most dilute and every dilution in-between. The measurement position automatically determined for these samples varied as a function of concentration. At the high concentrations, where the samples were turbid (1 to 0.01% w/v), the measurement positions automatically chosen were close to the wall of the cuvette. This minimized the path length over which the scattered light had to travel and hence multiple scattering. For the lower sample concentrations where multiple scattering was not a problem, the measurement position automatically chosen was at the center of the cell to maximize the measurement volume and reduce laser flare. The sizes obtained across the whole concentration range are consistent and are all in specification [2,3] with the average diameter being 204.6 nm with a standard deviation of 1%.
For concentrations from 0.00001% to 0.1% w/v, the z-average diameters obtained are in specification. However, at higher concentrations, the increase in multiple scattering results in a reduction of the measured size; at neat concentration, the z-average had dropped to 50 nm. This measurement protocol of fixing the measurement position at the center of the cell is therefore only suitable for low sample concentrations.
For concentrations higher than 0.01% w/v, the z-average diameters obtained are in specification. The multiple scattering present due to the high concentrations has been minimized by the reduced path length associated with measuring close to the cell wall. However, as the sample concentration decreases, laser flare becomes significant and results in incorrect sizes being obtained with the lowest concentration giving a z-average diameter of 410 nm. This measurement protocol of fixing the measurement position at the wall of the cell is therefore only suitable for higher sample concentrations.
The results obtained at concentrations above 0.05% w/v are out of specification (too small) due to the influence of multiple scattering associated with the extended path length over which the light has to travel. A 90° detection angle is therefore only suitable for low sample concentrations.
From these results, the following points can be made:
By using a monodisperse standard the results displayed above will be the closest they can be, as increasing polydispersity will create the impact seen in Figure 2. Particles of different sizes will scatter light at different angles with varying efficiencies, the angular dependence in light scattering is described by Mie theory [4]. Therefore, when measuring a heterogeneous sample using the NIBS technology, the ability to measure a range of concentrations using a single angle removes any variation in measured particle size that would result from changing between backscatter to 90°.
The major benefit of the NIBS measurement is the ability to deliver single point scattering across multiple and varied sample conditions. This means that for the broadest size, concentration and scattering efficiency range, the result will be the same.
The alternative to NIBS is to use only 90° or backscatter, however this results in a very small dynamic range. Combining both 90° & backscatter increases the dynamic range to a point (still not to the range of NIBS), but gives the greatest compromise of all by sacrificing consistency of data.
This represents challenges from a number of perspectives. Many samples may become unstable upon dilution, the NIBS technology can detect these changes as the measurement methodology itself does not introduce a variable (based on measurement angle), this allows for more productive studies of aggregation versus concentration.
If the measurement methodology itself causes a change in particle size due to changing sample properties (e.g. concentration, scattering intensity), it becomes challenging for a user to understand if an actual size change is real or an artefact of the measurement.
[1] NIBS Patent: Fiber Optic Device for Detecting the Scattered Light or Fluorescent Light From a Suspension (2000) United States Patent Number 6,016,195.
[2] International Standard ISO13321 (1996) Methods for Determination of Particle Size Distribution Part 8: Photon Correlation Spectroscopy. International Organization for Standardization (ISO).
[3] International Standard ISO22412 (2008) Particle Size Analysis: Dynamic Light Scattering (DLS). International Organization for Standardization (ISO).
[4] G. Mie, ”Contributions to the Optics of Diffusing Media“ (1908) Ann. Physik. 25, 377.