This technical note describes Zeta Potential Nanoparticle Tracking Analysis (Z-NTA), which adds the measurement of electrostatic potential to simultaneous reporting of nanoparticle size, light scattering intensity, fluorescence and concentration, and does so particle-by-particle. Individual particle analysis produces number-weighted, not intensity-weighted, data, avoiding any bias towards larger particles.
The zeta potential of a system is a measure of electrostatic charge characteristics of sample particles which can influence particle-particle interactions within a suspension. Understanding zeta potential is of critical importance in controlling dispersion and determining the stability of a nanoparticle suspension, for example to minimize aggregation for drug delivery and pharmaceutical applications (high zeta potential required), or to facilitate the removal of particles too small to filter out for water treatment applications (low zeta potential required to encourage aggregation) and is of great importance in nanoparticle research.
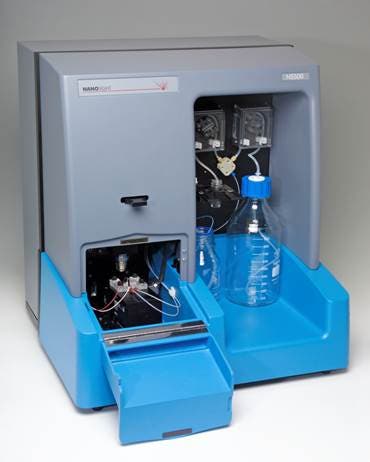
Zeta Potential Nanoparticle Tracking Analysis (Z-NTA) adds measurements of electrostatic potential to simultaneous reporting of nanoparticle size, light scattering intensity, fluorescence and concentration, and does so particle-by-particle. Individual particle analysis produces number-weighted, not intensity-weighted, data, avoiding any bias towards larger particles. Polydisperse and complex suspensions of both positively and negatively charged particles are readily characterized, and the results are verified by real-time observation of particles moving under both electrophoresis and Brownian motion, without the need for any particle labelling. Changes in the zeta potential distribution with pH, concentration, temperature and particle size can be studied, and aggregation can be measured quantitatively in real-time. Z-NTA measurements can be made using the NanoSight NS500 instrument, Figure 1. No other methodology comes close to providing such simultaneous, multiparameter nanoparticle characterization.
|
The zeta potential of a system is a measure of charge stability. This can be closely linked to the particle’s surface charge in simple systems but is also heavily dependent on the properties of the diluent solution. The zeta potential is the measure of the electric potential at the slip plane between the bound layer of ions surrounding the particle, and the bulk solution.
For a charged particle in liquid suspension, the electrical potential will decrease as you move further away from the particle’s surface. For aqueous diluents, the ions are influenced by this potential and form a charge imbalanced region around the particles, called a ‘double layer’. This diluent layer acts to counteract the particle’s electrical potential, screening it from the bulk solution, and controlling the rate at which the overall effective potential decreases with distance. The zeta potential for each particle in the suspension is the measure of the electrical potential at the slip plane between the particle and the bulk solution. This slip plane lies outside of the particle’s surface, due to a thin layer of ions that are electrically bound so tightly to the particle surface that they effectively move with the particle through the bulk solution. It is the electrical potential at this point, the ‘zeta potential’, that is the main controlling factor of the stability of sample particles in liquid suspension, i.e. to what degree aggregation will occur over time.
A higher level of zeta potential results in greater electrostatic repulsion forces between the particles. This repulsion leads to greater separation distances between particles in the suspension, reducing aggregation/flocculation caused by Van der Waals interactions. A zeta potential of +/-30 mV is often used as an approximate threshold for stability. Sample particles with measured zeta potentials of between -30 mV and +30 mV will have a tendency to aggregate over time, while particles with a zeta potential magnitude just greater than 30 mV (independent of sign) should be marginally stable, with the degree of stability over longer time scales increasing as the zeta potential magnitude increases.
The zeta potential of a particle in a particular liquid suspension is dependent on the electrical charge on the particle’s surface and the properties of the diluent solution. For example, altering the solution pH will change the surface charge of the sample particles, while altering the ionic strength will change how efficiently the diluent double layer can act to shield the particle’s electrical potential. Altering either of these factors may change the zeta potential for a particle in that solution. Zeta potential measurements are therefore highly sensitive to sample suspension properties and can be used to determine optimum dispersion protocols and to study the stability of samples under changing conditions.
The NanoSight Z-NTA system allows the zeta potential of nanoparticles in aqueous suspension to be measured on a particle-by-particle-basis. The zeta potential of a particle cannot be measured directly, but can be calculated from measurements of the velocity of a particle in suspension when an electric field is applied (electrophoretic mobility). The customized zeta potential sample chamber is fitted with platinum electrodes, which allow a variable electric field to be applied to a sample of nanoparticles suspended in aqueous solution.
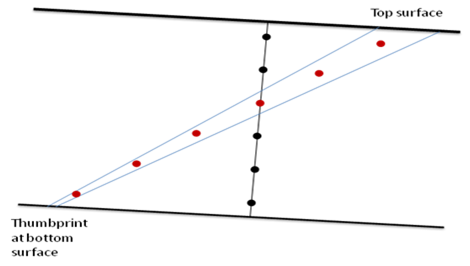
The electric field causes motion of the sample particles, (electrophoresis), and the aqueous diluent, (electro-osmosis). The NanoSight technique records the total apparent drift velocity for each tracked particle, which will be a superposition of these two motions. By observing the total velocity at different depths within the closed sample chamber, and assuming a zero net flow summed over the entire chamber depth, it is possible to separate these two components. The electrophoretic mobility (due to the electrical force on the particles) can therefore be measured for every particle tracked by the NanoSight software. This electrophoretic mobility can then be used to calculate zeta potential on a particle-by-particle basis.
Due to the unique optical configuration employed by the NanoSight instruments, any electric field introduced to the sample will be applied parallel to and in close proximity with the optical glass surfaces of the sample chamber. In this situation, electro-osmosis (motion of the diluent molecules under an electric field) will occur within the sample chamber. This motion affects the measurements of particle mobility made by Z-NTA and will vary in magnitude and direction according to the location of the observation point within the sample chamber.
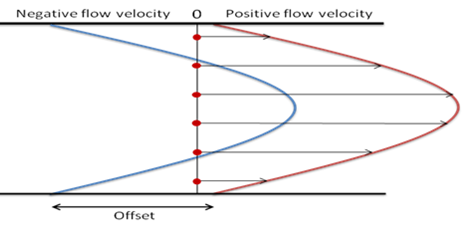
Glass accumulates a negative surface charge on contact with water. This causes a charge imbalance of the diluent molecules near to the top and bottom glass surfaces in the sample cell, with a small layer of diluent with effectively net positive charge adjacent to the glass. When an electric field is applied parallel to this diluent layer, it experiences an electromotive force and begins to move. Viscous forces then carry the fluid flow throughout the chamber. For a closed system, the resulting flow profile is parabolic, balancing the electromotive and the pressure driven forces, with a net zero total flow when summed over the chamber depth.

|
The movement of the diluent molecules will act to carry the suspended particles along with the bulk fluid and therefore contribute to the total apparent particle velocities observed by the NanoSight Z-NTA technique. A suitable analogy for this would be a person walking at a set speed (charged particle moving in an electric field), along a moving escalator (bulk fluid motion). The total velocity seen by an outside observer (Z-NTA observations), would not be a measurement of the walking speed (electrophoretic velocity) that is required.
In the closed NanoSight sample chamber, the contribution of the water motion depends on the observation depth, with the electro-osmotic profile also prone to variation as the glass surfaces interact with the sample particles. In order to obtain a measurement of the electrophoretic mobility for each particle, the electro-osmotic flow must therefore first be profiled as part of each experimental measurement. The electro-osmotic contribution to the total velocity at the analysis position can then be calculated as an offset which can be subtracted from the particle-by-particle results.
The NanoSight NS500 instrument, which incorporates motorized stage control, can automatically scan along the laser beam, recording total velocity measurements, averaged over all particles, at positions covering the chamber depth. Regardless of the individual charges of the particles in the population, the shape of this total velocity profile will represent the shape of the electro-osmotic velocity profile (any additional electrophoretic motion is independent of chamber depth). This total velocity profile is then offset so that there is a net zero flow when summed over the entire chamber depth (holds true for purely electro-osmotic flow for a closed system), to form a simulated electro-osmotic profile. This simulated profile can then be used to compensate for the effect of electro-osmosis on the particle-by-particle velocity results at the primary measurement location.
The NanoSight technique automatically measures the total velocity profile in this way for each zeta potential measurement run. This provides high resolution particle-by-particle zeta potential distributions where the electro-osmotic effect is always characterized and accounted for, without the need to assume that the diluent flow profile or the chamber surface chemistry remains constant.
|
|
Once the velocity components due to electro-osmosis and thermal convection have been removed, the corrected drift velocities, calculated on a particle-by-particle basis, then provide a measure of the electrophoretic velocity of each particle in the sample.
The electric field strength (E) within the flow cell is determined using the Voltage (V) applied through the sample by the electrodes, and the distance between the electrode surfaces (d).

|
The particle velocities can then be converted into electrophoretic mobilities (velocity divided by electric field strength).
By application of the Henry equation using the Smoluchowski approximation (appropriate for aqueous diluent media with moderate electrolyte concentration), the zeta potential (ZP) for each particle can be calculated:

|
where µ is the electrophoretic mobility of the particle, ε 0 is the permittivity of free space, εr is the relative sample solution permittivity and η is the sample solution viscosity.
Monodisperse single particle populations, such as NIST polystyrene size standards, are often only described in terms of an average or modal zeta potential value. In reality however, sample particles will always have a range of values and knowledge of the full zeta potential distribution through Z-NTA measurements can provide much more information. This is especially critical where small changes in the zeta potential distribution have a large effect on the behaviour of a nanoparticle product, or for the detailed comparison of samples which may all be close to the stability threshold.
For a wide range of monodisperse and complex polydisperse sample populations, the Z-NTA particle-by-particle measurement technique provides high resolution zeta potential distributions.
The Z-NTA technique allows the simultaneous and independent measurement of size, zeta potential and light scattering intensity for individual nanoparticles in solution. This allows particle populations to be separated in terms of any one of these parameters, and for the relationship between parameters, for example the dependence of zeta potential on particle size, to be studied.
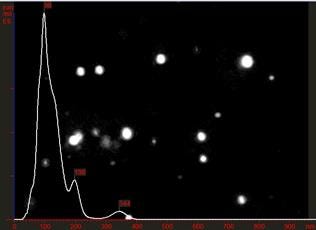
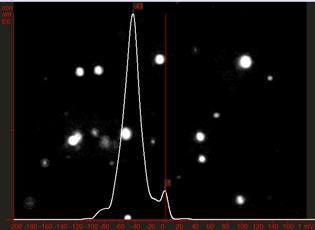
NTA sizing analysis on 100 nm polystyrene beads suspended in a diluted PBS solution sample is shown, Figure 5. A primary size peak at just below 100 nm is clearly discernible with some larger particles present at around 200 nm and 350 nm. Z-NTA analysis shows a zeta distribution with a primary peak at -43 mV, with some less charged particles present (zeta potential near zero), Figure 6.
|
|
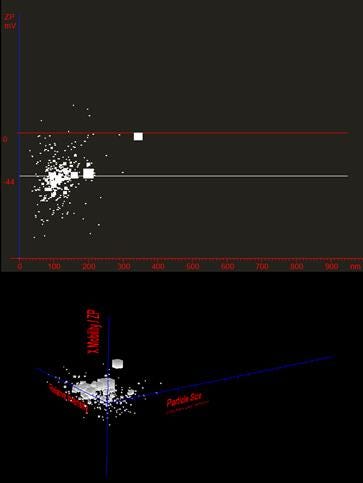
With other common zeta potential and sizing instruments, these two distributions are measured separately in different experimental runs, and therefore no further information can be obtained. Using Z-NTA, all measurement parameters are obtained simultaneously. Every particle analysed can be plotted in terms of its size and zeta potential, allowing any relationships to be seen, Figure 7.
The Z-NTA scatter plot reveals that the size peak at 200 nm is associated with particles of similar zeta potential to the primary population. These are therefore likely to be polystyrene particles that have aggregated, but retain the same surface charge density (zeta potential independent of size). The peak at 350 nm, however, is associated with a near zero zeta potential, indicating particles of different material or with different surface charge characteristics to the primary sample population, Figure 7.
|
With the ability to review video images it can be visually confirmed that this individual particle produces this particle track signature in the data, identifying the presence of a single neutrally charged contaminant in a charged particle suspension. This kind of resolution is not possible with any ensemble technique.
As zeta potential measurements depend on the properties of the sample particles and the diluent solution, a single zeta potential value only applies to one suspension preparation. Studies of zeta potential variations under changing sample conditions are needed to fully understand sample behaviour.
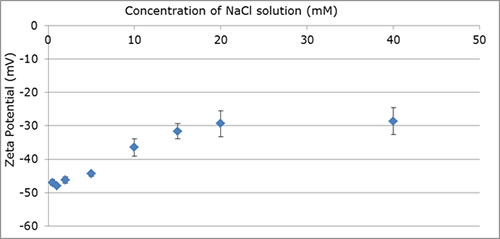
A study of the modal zeta potential of 100 nm polystyrene beads suspended in NaCl solutions of increasing molarity, demonstrates the effect of ionic strength on sample stability, Graph 1.
|
As the ionic strength of the solution increases, the voltage applied to the electrodes must be reduced in order to prevent unstable thermal convection flows, driven by high current through the sample, introducing errors in the zeta potential results. Using a reduced voltage can affect the measurement accuracy due to the reduced particle motion, as shown by the variation in error bars in the example plot, but extends the sample conductivity range in which zeta potential can be measured using Z-NTA. In this example study with NaCl solution, the ability to vary the applied voltage allows the measurement of zeta potential in up to 40 mM solutions.
Zeta Potential Nanoparticle Tracking Analysis (Z-NTA) adds measurements of electrostatic potential to simultaneous reporting of nanoparticle size, light scattering intensity, fluorescence and concentration, and does so particle-by-particle. Individual particle analysis produces number-weighted, not intensity-weighted, data, avoiding any bias towards larger particles. Polydisperse and complex suspensions of both positively and negatively charged particles are readily characterized, and the results are verified by real-time observation of particles moving under both electrophoresis and Brownian motion, without the need for any particle labelling. Changes in the zeta potential distribution with pH, concentration, temperature and particle size can be studied, and aggregation can be measured quantitatively in real-time. No other methodology comes close to providing such simultaneous, multi-parameter nanoparticle characterization.