A catalyst is a material that alters the rate of a reaction without itself being changed (although the form of the catalyst may change during the process). This application note deals with heterogeneous catalysts, where the catalyst is present in one phase (a solid) and the reactants are in another (liquid or gas). For this type of catalyst, the reaction rate depends on the surface area of the solid material (as this defines the contact area between the catalyst and the reactants).
Decreasing the particle size of a substance increases its surface area, as surface area is inversely proportional to the square of the particle diameter. Surface area and particle size are, therefore, typical measurements for characterising catalysts. Decreasing the particle size would appear to be an ideal way of increasing the reactivity of a catalyst. However, a smaller particle size is not always beneficial. For reactors that process liquids (e.g. Raney Nickel for fat hydrogenation) and gasses (e.g. Haber synthesis of ammonia) a catalyst with too fine a particle size can cause the following problems:
Balancing the efficacy of the catalyst (measured by reactivity, poisoning tendency etc.) with reducing the risks of the above, means that there is usually an optimum particle size range for a catalyst.
It is not possible to cover every catalyst material and its measurement requirements as part of this application note. Examples of catalyst materials successfully measured on laser diffraction equipment include:
In this note, we will describe the measurement of typical FCC catalysts, using both wet and dry dispersion methods. We will also show how the method development process for dry powder measurements can provide additional information regarding the attrition behavior of catalysts. Attrition behavior can be important in determining the catalyst lifetime within fluidized bed reactions.
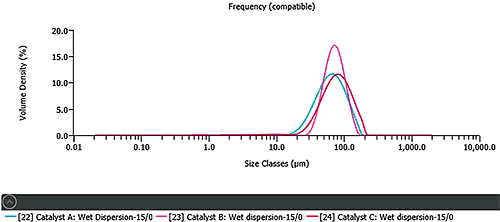
The particle size of three different FCC catalysts was measured using wet dispersion. The process of wet dispersion involves wetting of the powder with a suitable liquid, followed by applying ultrasound to promote separation of agglomerates. The dispersion conditions for these samples were optimized following the process outlined in Malvern Application Note MRK561. Figure 1 shows that the samples have similar median particle sizes (60-80μm). However, catalyst A and C have broader particle size distributions compared to catalyst B.
|
|
The surface area of a catalyst is important in defining its activity. Specific surface area is generally measured using BET physisorption techniques, with chemical characterization from chemisorption. The surface area reported by these techniques is affected by the size of the absorbing molecule. Smaller molecules can generally penetrate further into the surface microstructure and particle pore network than larger molecules, yielding higher calculated values for surface area.
A specific surface area can be calculated from a laser diffraction measurement, by converting the measured volume distribution into a surface area distribution. A surface area based on the overall contour of the particle can then be calculated. This surface area tends to be smaller than the results of a BET measurement where the probe gas can absorb onto the internal porous structure of the catalyst.
The Mastersizer 3000 calculates the SSA by converting the reported volume distribution into a surface area distribution using the Hatch-Choate equations [1]. The general equation linking the SSA with particle size is:
where the D[3, 2] is the surface area moment mean or Sauter Mean Diameter (SMD). In the Malvern software the value for the SSA is in initially calculated in m2/cm3, and is converted to m2/g through the input of the particle density. The value obtained is very much related to the finer material present in the system - halving the particle size will cause a 4-fold increase in SSA (as the surface area is inversely proportional to d2).
Table 1 shows the values for the surface area obtained for the FCC catalysts tested here using laser diffraction.
Catalyst | D[3,2] / microns | SSA / m2.kg |
|---|---|---|
A | 40.9 | 54.4 |
B | 74.8 | 33.2 |
C | 38.5 | 57.7 |
This suggests that the SSA of catalysts A and C are similar, whereas catalyst B displays a much smaller SSA. The higher SSA for samples A and C relates to the fine material present within these products.
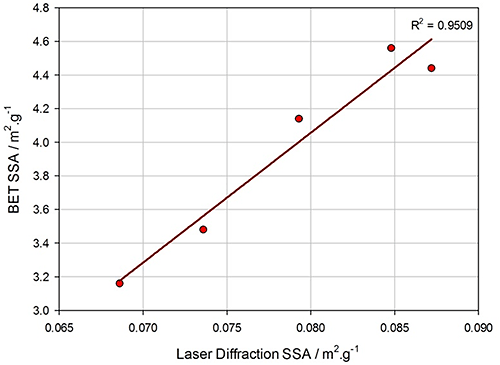
For these samples we do not have corresponding BET data to compare with the laser diffraction results. However, Figure 3 shows a comparison of SSA results from BET with calculated SSA from laser diffraction for milled barium ferrite samples. This shows a strong linear relationship, therefore, laser diffraction can be used to predict likely catalytic activity or provide a method for QC analysis.
|
The previous example showed the results of catalyst measured using wet dispersion. However, laser diffraction can also be used to measure powders in dry dispersion. Dry powder dispersion is achieved by entraining particles in a compressed air stream. Agglomerates are dispersed by passing the sample through a venturi. The venturi accelerates the particles and causes dispersion via three different mechanisms: particle- particle collisions, particle-wall collisions, and the shearing of agglomerates during rapid acceleration and deceleration of the particles as they enter and exit the venturi.
The more aggressive of these dispersion mechanisms can cause particle attrition, so care must be taken in dry method development to ensure that this does not occur. Particle attrition can be detected by first carrying out a pressure titration, where the dispersion energy is changed by varying the pressure drop across the venturi. The correct dispersion pressure can be selected by comparing the results obtained at different pressures to a result obtained using wet dispersion, as described in Malvern Application note MRK524.
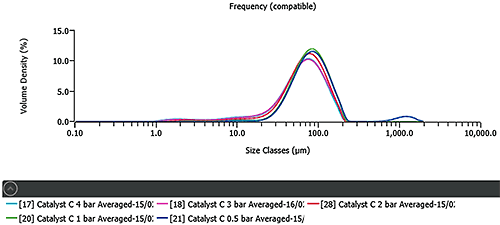
Figure 3 shows the results of a pressure titration for FCC catalyst C. The results at low pressures show large agglomerates, indicating that full dispersion has not been achieved. Increasing the pressure shows a decrease in particle size. Good agreement with the wet dispersion result, shown in Figure 1, is obtained at 1 bar pressure. The reduction in particle size that occurs above 1 bar pressure is, therefore, caused by particle attrition. The other FCC catalysts showed similar dispersion profiles.
|
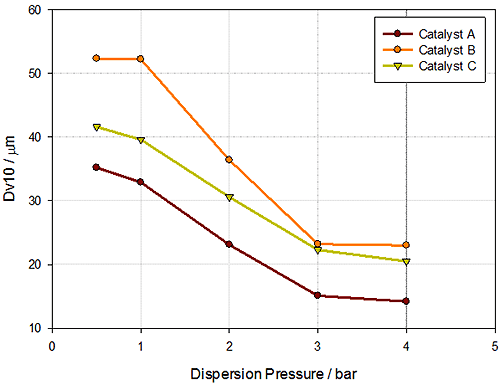
How the particle size of each catalyst varies with pressure can help to understand the risk of attrition, an important factor in predicting the life of catalysts in fluidized bed reactors. The variation of Dv10 with increasing dispersion pressure is most important, as the Dv10 will be most sensitive to increases in the fine particle fraction caused by attrition. Figure 4 shows the Dv10 vs. pressure for each of the FCC catalysts. This data has been used to calculate an 'attrition index' (AI), essentially the gradient of the Dv10 vs. pressure, which compares the Dv10 measured at low pressure (x1) to that measured at high pressure (x2):
where P1 and P2 are low and high pressures respectively.
Table 2 shows the AI values calculated for the FCC catalysts, confirming that A and C are similar in behavior. The similarity in attrition behavior means that A and C would have a similar lifetime within a fluidized bed. Catalyst B has a more negative AI, which may mean that catalyst B will have a shorter lifetime compared to A and C.
Catalyst | AI / µm.bar-1 |
|---|---|
A | -6.0 |
B | -8.4 |
C | -6.0 |
The Mastersizer 3000 can accurately determine the particle size distribution for a wide range of catalyst materials. In addition to calculating a specific surface area, a unique feature this technique is the ability to predict attrition rate in a fluidized bed using dry powder measurements at different pressures.
[1] T Hatch, S P Choate, "Statistical description of the size properties of non-uniform particulate substances" J. Franklin Inst., 207, 369-387 (1929)
[2] A F Rawle "Micron sized nano-materials" Powder Technology, 174, 6-9, (2007)