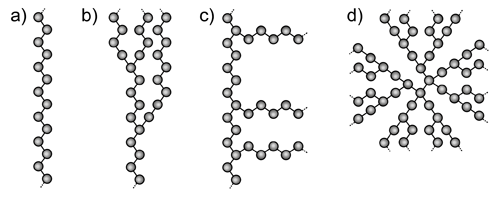
Polymers can be loosely grouped into two structural categories - linear and branched. A linear polymer is composed of a single main chain of repeating units, linked in a regular end to tail fashion. Branched polymers on the other hand, come in various different forms. Comb polymers have branches of similar structure emanating from the main polymer backbone. Random branched polymers have many different branching points, with variable branch lengths, attached not only to the backbone, but to the branches as well. Star branched polymers, and dendrimers, begin at a central point, with symmetrical branches radiating outward from the core. These structures are represented schematically in Figure 1.
|
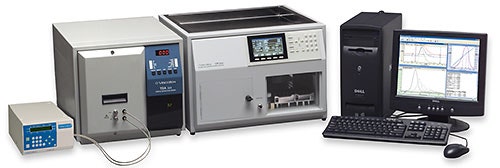
Homopolymer molecular weight distributions are routinely characterized using Gel Permeation / Size Exclusion Chromatography (GPC/SEC), by comparing the elution profile of the unknown polymer to that of a known standard. The approach, called column calibration, can be avoided, through the use of advanced multi-detection GPC/SEC systems, such as the Viscotek TDAmax, which integrates a light scattering detector (Right angle light scattering - RALS, Low angle light scattering - LALS) with a concentration detector (RI or UV) to generate an absolute molecular weight measurement for each slice of the chromatogram. A bridge viscometer is also included, to accommodate measurement of the intrinsic polymer viscosity. For block copolymer composition, a second concentration detector can be added, one detector used for measuring the amount of component B and the second for measuring the combination of A + B.
Aside from the specific property measurement capabilities associated with each unique detector included in a multi-detection GPC/SEC system, additional information can be generated by coupling the signals from the different detectors. For example, coupling the intrinsic viscosity result from the viscometer detector with the molecular weight from the light scattering detector facilitates calculation of the hydrodynamic radius (equivalent to the radius measured by DLS). Polymer branching is another tangential property that can be determined by coupling the light scattering detector with the intrinsic viscosity detector.
Four samples of synthetic copolymers were characterized with a Viscotek TDAmax system, equipped with two ViscoGEL columns. The first sample was a linear copolymer. The other three were randomly branched copolymers, labeled low branching (low-brch), medium branching (mid-brch), and high branching (high-brch). The samples were eluted from the GPC system, in a THF solvent, operating at a flow rate of 1mL/min. The molecular weight, polymer intrinsic viscosity, and Stokes radius for each of the copolymers were calculated directly using the Viscotek OmniSEC software. The average branching and branching frequency were also calculated from the OmniSEC software, using the Zimm-Stockmayer equations.
|
|
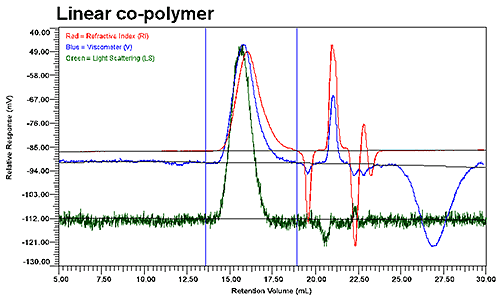
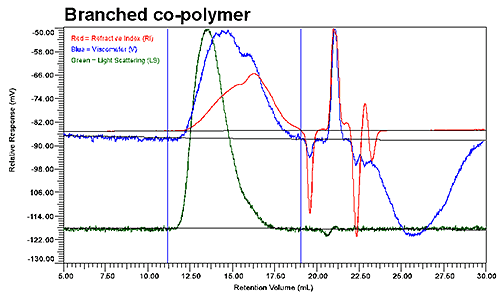
Figure 2 shows the GPC results for the linear and low branching copolymer samples. Although the UV signal is not presented in these graphs, it was used to verify the polymer composition throughout the distribution of co-polymer. As evident in the two chromatograms shown in Figure 2, the elution profiles of the linear and branched copolymers differ significantly, with the viscosity and refractive index detectors indicating two populations within the integration limits for the branched copolymer, but only a single population for the linear copolymer.
| Sample ID | Mn (Da) | Mw (Da) | Mw/Mn | [η] (dL/g) | dñ/dC (cm3/g) | RH (nm) |
|---|---|---|---|---|---|---|
| Linear | 4838 | 14488 | 2.99 | 0.0927 | 0.083 | 2.60 |
| Low-brch | 5158 | 87918 | 17.0 | 0.1080 | 0.083 | 4.47 |
| Mid-brch | 4168 | 84264 | 20.2 | 0.0953 | 0.092 | 4.07 |
| High-brch | 6159 | 79075 | 12.8 | 0.0946 | 0.093 | 4.12 |
Table 1 shows the standard measured and calculated polymer properties available from the TDAmax system, including the weight (Mw) and number (Mn) average molecular weights, the polydispersity (Mw/Mn), the intrinsic viscosity ([η]), the refractive index increment (dñ/dC), and the hydrodynamic radius (RH).
The first observation of note from Table 1 is that the linear polymer, in comparison to the branched polymers, has a much smaller molecular weight and polydispersity. Despite this fact, the intrinsic viscosity for all four samples are similar, a coincidence in this case as the ratio of the size over the molecular weight is almost constant for all samples. The dñ/dC values are calculated from the refractive index signal and known injection mass, and are indicative of the copolymer composition. As noted in Table 1, the linear and low-brch copolymers have identical dñ/dC values. As the degree of branching increases, so does the measured dñ/dC value. This trend reflects the different composition in the copolymer favoring the branching.
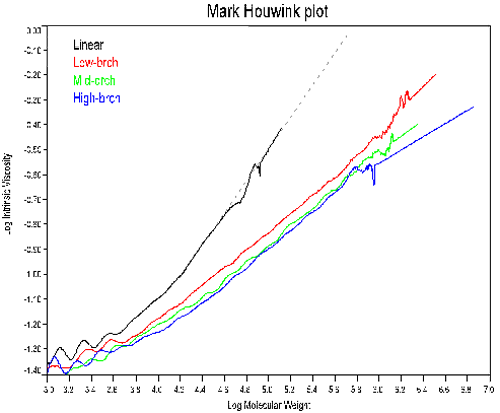
In order to measure the degree of branching, the same polymer with a linear structure needs to be available, or the Mark-Houwink parameters (K and a) for the linear polymer must be known. Figure 3 shows the Mark-Houwink plots for the 4 copolymers. The linear sample was used to determine K and a.
|
As noted in Figure 3, the slope of the Mark-Houwink plot decreases with increasing polymer branching. This trend parallels the dependence of dñ/dC on branching, an indication of the composition effect on branching. At constant molecular weight, an increase in branching will result in a decrease in size and a subsequent decrease in the intrinsic viscosity. So the decreasing slopes in Figure 3 are not unexpected. Note, that the trend line for the linear polymer in Figure 3 was used to extrapolate the expected intrinsic viscosity values for branching calculations.
The first step in calculating the branching parameters for polymer samples is to calculate the molecular weight dependence of g', defined as the ratio of the intrinsic viscosity ([η]) of the branched polymer to that of the linear polymer, as shown below.
|
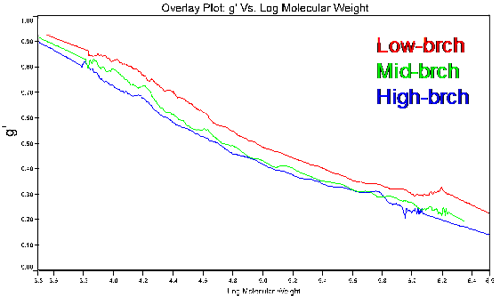
Figure 4 shows a plot of the molecular weight dependence of the contraction factor g' for the branched copolymers in this study. There are two observations of interest in this figure. First, the general trend of the low branching on the top and high branching on the bottom, with all converging to 1 in the limit of low molecular weight. This observation is consistent with expectations, as an increase in branching would lead to a decrease in the viscosity and a subsequent decrease in g'. In the limit of low molecular weight, the amount of branching would go to zero; hence the convergence to g' = 1 in the limit of low MW. The second observation of importance is that the medium and high branching g' results converge at higher molecular weights due to the chemistry of how the polymers were made, having closer number of branches at higher molecular weight.
|
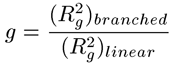
The second step in calculating branching parameters for polymer samples is to determine g, defined as the square of the ratio of the radius of gyration (Rg) of the branched polymer to the Rg of the linear polymer. Not to be confused with the hydrodynamic radius (Rh,) derived from dynamic light scattering viscosity measurements, the radius of gyration is the root mean square radius derived from angle dependent static light scattering measurements. In many cases, including this example, it is impossible to determine Rg as there is no angular dependence of the light scattered from small molecules. In the absence of Rg information, g can also be determined from g', using the structure factor B, as shown in the expression below. For branched polymer systems, B ranges from 0.5 for low branching to 1.5 for high branching, with medium branching systems having a B value of 0.75.
|
With

|
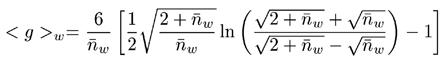
The final step in determining branching parameters for polymer samples is to calculate the branching number and frequency from the known g value using the appropriate Zimm-Stockmayer expression. The Zimm-Stockmayer equations are a series of polymer shape (e.g. star branched, linear, etc), polydispersity, and number of arms per branching point dependent expressions relating the branching number to the contraction factor g. The copolymers characterized in this study were polydisperse, random, tri-functional polymers. The Zimm-Stockmayer expression for this type of polymer is given below, where nw is the branching number.
|
The branching frequency (λ), can then be determined from the expression shown below, where Mi is the mass for each chromatographic slice and FR is the repeat factor, defined as the mass of 100 repeat units.
|
|
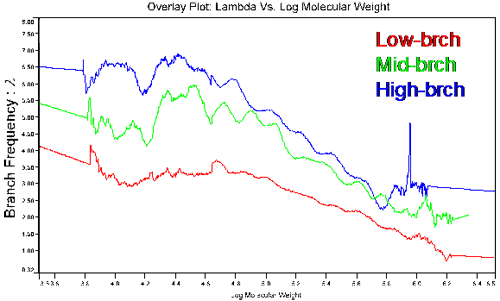
Figure 5 shows the molecular weight dependence of the branching frequency for the three copolymers characterized in this study. This figure shows the most contrasting results presented so far, with clear differences between the three polymers. Even the mid and high branching polymers, which tended to converge at higher molecular weights in the [η] and g' figures, show clearly different branching frequencies.
| Sample ID | Branches | Branch Freq. |
|---|---|---|
| Linear | 0 | 0 |
| Low-brch | 17.8 | 2.68 |
| Mid-brch | 26.2 | 3.82 |
| High-brch | 29.2 | 4.99 |
Table 2 reports the average number of branches, nw, and the weight average branching frequency, λ. Both were calculated by comparing the viscosity of the branched sample to the linear one at each molecular weight. The low-brch has the lowest expected frequency, 2.68, while the high-brch has the highest with a branching frequency close to 5 branching point per 100 repeat units. Although the graph of g' versus molecular weight did not show a big difference in branching in the 3 samples, the resulting values for the branching frequency varied greatly, showing the sensitivity of this parameter.
Samples provided by Dr. Robert Hunter of Unilever Research and Strathclyde University
Modern Methods of Polymer Characterization, H. G. Barth, J. W. Mays Eds. Wiley-Interscience, 1991. Chapter 3, "Measurement of long-chain branch frequency in synthetic polymers" A. Rudin
Structural Characterization of Polymers in Solution by Quasielastic Laser Light Scattering, A.M. Jamieson and M.E. McDonnell, Probing Polymer Structures; Am. Chem. Soc. Adv. Chem. Ser. 174, p. 163, American Chemical Society, Washington, DC., 1979
Light-scattering Characterization of the Molecular Weight Distributions of Some Intractable Polymers, C. Wu, Polym. For Adv. Tech. 8, p. 177.
|
The Viscotek TDAmax is a complete size exclusion chromatography (SEC) system, integrating a combined autosampler, pump, and degasser (GPCmax), a thermally controlled column compartment, and a triple detector array, including light scattering, viscometry, and differential refractormetry (RI) detectors.
The system control, data collection, and chromatographic analysis is delivered in one complete package by the Viscotek OmniSEC software.