
Gold nanoparticles are one of the most popular and extensively researched type of nanoparticle. Many characterization techniques exist that provide a wealth of information. Nanoparticle Tracking Analysis is a powerful complementary technique for high resolution analysis of particle size distributions and concentration measurement. In this application note, example sample types are discussed with measurement examples to show the strength of the NTA technique. NTA offers a unique capability to characterize colloidal samples by directly visualizing nanoscale particles in suspension (10nm to 2000nm) with high-resolution, in real-time, and with minimal sample preparation.
Gold nanoparticles are one of the most popular and extensively researched type of nanoparticle. A Google Scholar search of the term “gold nanoparticles” results in over 500,000 hits. Applications range from the biological to the material, and include nanomedicine, drug delivery, cancer diagnostics, biological scaffolds, biosensors, contrast agents, catalysts, and CMP slurries for the manufacturing of microprocessors [1].
This wide ranging application space is made possible by their versatile optical properties, compatibility with a variety of surface chemistries, and their well-studied synthesis and preparation.
Common characterization tools include transmission or scanning electron microscopy (TEM/SEM), dynamic light scattering (DLS), and Ultra Violet-Visible absorbance (UV-Vis). These tools provide a high degree of information. For example, UV-Vis can be used to measure shifts in the surface plasmon resonance absorbance to monitor surface conjugation and aggregation state, but provides little direct information about particle size. TEM and SEM can provide extremely high resolution images for size and shape determination, but requires extensive sample preparation and cannot analyze particles in suspension. DLS is a ubiquitous technique to rapidly measure particle size, but it cannot measure particle concentration and lacks the resolution to resolve multiple populations of similarly sized particles. These are important characterization tools, but ultimately are limited in that they cannot provide high resolution size distributions or particle concentrations of colloidal particles in solution.
Nanoparticle Tracking Analysis (NTA) utilizes the properties of both light scattering and Brownian motion in order to obtain the particle size distribution of samples in liquid suspension. A laser beam is passed through the sample chamber, and the particles in suspension in the path of this beam scatter light in such a manner that they can easily be visualized via a 20x magnification microscope onto which is mounted a camera. The camera, which operates at approximately 30 frames per second, captures a video file of the particles moving under Brownian motion within the field of view of approximately 100 µm x 80 µm x 10 µm.
The movement of the particles is captured on a frame-by-frame basis. The proprietary NTA software simultaneously identifies and tracks the center of each of the observed particles, and determines the average distance moved by each particle in the x and y planes. This value allows the particle diffusion coefficient to be determined from which, if the sample temperature and solvent viscosity are known, the sphere equivalent hydrodynamic diameter of the particles can be identified using the Stokes-Einstein equation.
In addition, the particles’ movement is measured within a fixed field of view (approximately 100 µm by 80 µm) illuminated by a beam approximately 10 µm in depth. These figures allow a scattering volume of the sample to be estimated; by measuring concentration of the particles within this field of view and extrapolating to a larger volume it is possible to achieve a concentration estimation in terms of particles per mL for any given size class or an overall total.
As a result, NTA can be used as a rapid and routine characterization tool that has the resolution to distinguish between multiple populations of similarly sized particles, the sensitivity to detect size differences before and after modifying surface chemistry, and directly counts particles to provide gold nanoparticle dosimetry in therapeutic applications.
Here we present examples of different types of gold nanoparticle samples characterized by NTA.
Gold colloids can be notoriously prone to aggregation in sub-optimal conditions. The following example is of a NIST-standard quality 30 nm gold colloid shows the importance of ensuring high quality purity of diluents when handling gold colloids.
Calibrated 30 nm gold particles (NIST) were diluted into three types of water: tap, de-ionized and 18 MΩ water (all free from nanoparticles) then analyzed with the same concentration using the NanoSight system. The plots show that the degree of aggregation depends on water purity with only the pure 18 MΩ water causing no aggregation, DI water showing mild aggregation, and tap water causing the most aggregation.
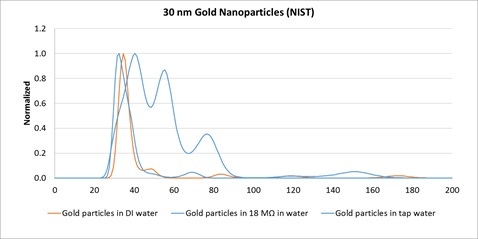
Figure 1: Normalized NanoSight size distributions of 30 nm Gold nanoparticles from NIST dispersed into DI water (red line), 18 MΩ water, and tap water.
In this example, we show DNA ligand-induced aggregation of oligonucleotide-functionalized gold colloid. A suspension of a mixture of 60 nm 3’- and 5’-oligonucleotide-functionalised gold nanoparticles before and after addition of a DNA sample which bound to the 20-mer oligonucleotides immobilized on the gold nanoparticles (Figure 2). Mean size was seen to increase from 61 nm to 81 nm following dimerization. The quantities of DNA ligand added to induce this detectable level of aggregation were extremely low and increase in mean size measured by NanoSight potentially provides an alternative to fluorescence based assays or signal amplification procedures such as PCR, in nucleic acid diagnostics.
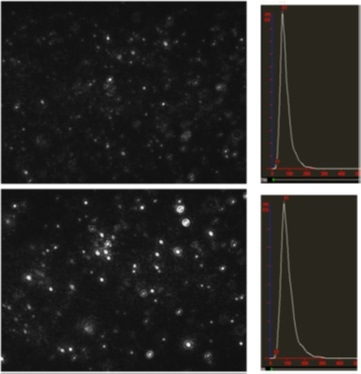
Figure 2: NanoSight movie still frames and size distributions of 60 nm gold before (top panels) and after DNA ligand induced aggregation (bottom panels).
Rod-shaped gold particles have an additional absorbance peak due to the longitudinal surface plasmon resonance, while retaining the highly versatile surface chemistry of spherical gold particles. This has enabled gold nanorods to be used in ultra-sensitive photonics sensing applications and in photo thermal therapies.
This example shows NanoSight size characterization of gold nanorods 44 nm in length conjugated to various polymer, surfactant, or proteins of increasing size. Size measurements show a size of 44 nm for citrate, 45 nm for MUA, 49 nm for mPEG-thiol (1 kDa), 49 nm for mPEG-thiol (5 kDa), 51 nm for mPEG-DTC (5 kDa), 53 nm for Tween 20 (1.2 kDa), and 59 nm for human serum albumin[2].
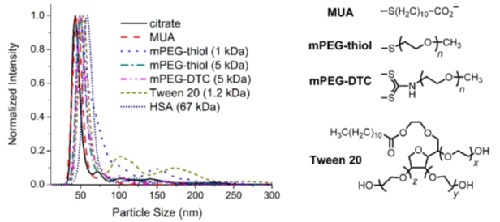
Figure 3: Overlayed NanoSight size distributions for gold nanorods conjugated to citrate, MUA, mPEG-thiol (1 kda), mPEG-thiol (5 kDa), mPEG-DTC (5 kDa), tween 20 (1.2 kDa), and HSA.
NanoSight has the sensitivity to measure high scattering materials like gold and silver down to 10 nm. In this example, we show that the sample contains a major population at 15 nm, in addition to a low number count of larger particles up to 100 nm, likely to be gold aggregates (Figure 3). Despite the presence of these presumed aggregates, NanoSight analysis provides a high resolution number weighted size distribution to accurately measure the size and concentration of the primary particle population.
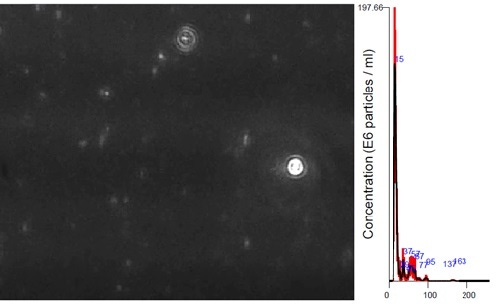
Figure 4: NanoSight movie still frame and size distribution of gold nanoparticles hydrodynamic diameter 15 nm.
One of the important but often overlooked properties of therapeutic nanoparticle systems is the formation of a protein corona upon exposure to serum proteins. This protein corona has been shown to have an effect on the biodistribution and pharmacokinetic properties of nanoparticles in biological systems [3]. As nanomedicines are increasingly being translated into clinical applications, it is vital to understand and characterize the formation and size of the protein corona.[4]
In this study by James and Driskel [5], 80 nm gold nanoparticles were dispersed in a solution that contains IgG ranging in concentration from 1 ng/mL to 10,000 ng/mL (Figure 5). NanoSight results show a size increase from 80 nm to approximately 95 nm, consistent with the formation of a multi-layered protein corona. DLS intensity weighted results are likely influenced by the presence of larger protein aggregates in the sample, providing a mean size of 160 nm, a size that is inconsistent with a discrete protein corona.
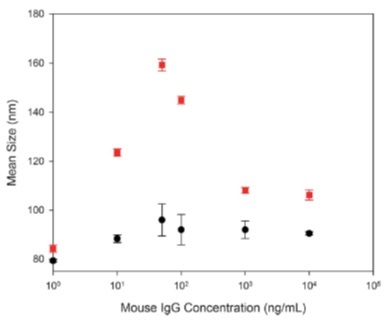
Figure 5: NTA (black circles) and DLS (red circles) size results for 80 nm gold nanoparticles dispersed into IgG of different concentrations (1 ng/mL to 10,000 ng/mL).
Nanoparticle dosimetry is another important parameter to characterize for the successful clinical translation of nanomedicines. Increasingly, in vitro toxicology models are taking into account the effects of nanoparticle settling, and agglomeration in cell culture. The difference between the administered dose and delivered dose can have significant impact on the therapeutic outcomes. For in vivo models, accurate particle concentration of the administered dose is crucial in predicting pharmacokinetic outcomes [6].
A new generation of in vitro pharmacokinetic models take into account both diffusion and sedimentation of engineered nanomaterials to better predict therapeutic outcomes and to gauge toxicity.[7] In particular, it is important to measure the particle size and concentration, both of which are readily measured by NTA.
These transport models require particle size, particle concentration, effective density, viscosity, temperature, among other parameters. NTA can directly measure both particle size and concentration, providing key characterization parameters in these models.
Nanoparticle dosimetry is another important parameter to characterize for the successful clinical translation of nanomedicines. NanoSight is one of the few analytical tools that can directly measure the particle concentration of colloidal suspensions.
In the following example[8], a NanoSight system is coupled to a series of on-line analytical tools to provide the rapid and orthogonal characterization of size and concentration for silicon oxide nanoparticles in media using NTA, MALS, and ICP-MS.
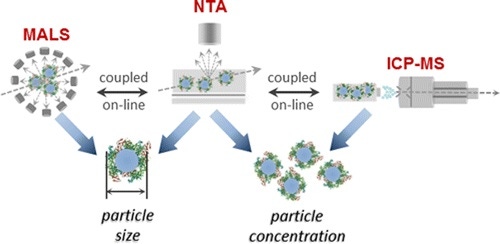
Figure 6: On-Line system of NTA, MALS, and ICP-MS for rapid and orthogonal characterization of particle size and concentration.
[1] Marie-Christine Daniel and Didier Astruc. Gold Nanoparticles: Assembly, Supramolecular Chemistry, Quantum-Size-Related Properties, and Applications toward Biology, Catalysis, and Nanotechnology. Chem. Rev. 2004, 104, 1, 293–346.
[2] Jonathan G. Mehtala and Alexander Wei. Nanometric Resolution in the Hydrodynamic Size Analysis of Ligand-Stabilized Gold Nanorods. Langmuir 2014, 30, 13737−13743.
[3] Xiaju Cheng, Xin Tian, Anqing Wu, Jianxiang Li, Jian Tian, Yu Chong, Zhifang Chai, Yuliang Zhao ,Chunying Chen, and Cuicui Ge. Protein Corona Influences Cellular Uptake of Gold Nanoparticles by Phagocytic and Nonphagocytic Cells in a Size-Dependent Manner. ACS Appl. Mater. Interfaces 2015, 7, 20568–20575.
[4] Martin Lundqvist, Johannes Stigler, Giuliano Elia, Iseult Lynch, Tommy Cedervall, Kenneth A. Dawson. Nanoparticle size and surface properties determine the protein corona with possible implications for biological impacts. PNAS 2008, 105, 14265–14270.
[5] Andre E. James and Jeremy D. Driskell. Monitoring gold nanoparticle conjugation and analysis of biomolecular binding with nanoparticle tracking analysis (NTA) and dynamic light scattering (DLS). Analyst 2013, 138, 1212-1218.
[6] Joel M Cohen, Justin G Teeguarden, and Philip Demokritou. An integrated approach for the in vitro dosimetry of engineered nanomaterials. Particle and Fibre Toxicology. 2014. 11:20.
[7] Glen M. DeLoid, Joel M. Cohen, Georgios Pyrgiotakis, Sandra V. Pirela, Anoop Pal, Jiying Liu, Jelena Srebric, and Philip Demokritou. Advanced computational modeling for in vitro nanomaterial dosimetry. Particle and Fibre Toxicology. 2015. 12:32.
[8] Dorota Bartczak, Phil Vincent, and Heidi Goenaga-Infante. Determination of Size- and Number-Based Concentration of Silica Nanoparticles in a Complex Biological Matrix by Online Techniques. Anal. Chem. 2015, 87, 5482–5485.