
The unique capabilities of the PIXcel3D detector allow micro-diffraction experiments with 2D detection capability on multi-purpose X-ray diffractometers, without the need to switch to other detectors for conventional powder diffraction measurements or high resolution applications.
Using a 2D detection system in microdiffraction experiments (in the following referred to as 2D micro-diffraction), the diffracted beams appear as arcs, known as Debye rings.
The unique capabilities of the PIXcel3D detector allow micro-diffraction experiments with 2D detection capability on multi-purpose X-ray diffractometers, without the need to switch to other detectors for conventional powder diffraction measurements or high resolution applications.
Using a 2D detection system in micro- diffraction experiments (in the following referred to as 2D micro-diffraction), the diffracted beams appear as arcs, known as Debye rings. These rings provide the user with an instant window to the microstructure of the sample giving hints about the homogeneity of the sample (mapping experiment), the grain sizes and orientation distributions. Additionally, 2D micro-diffraction gives information about the phase composition in sub- mm2 spots in solid objects.
In this application note, 2D micro- diffraction examples are shown highlighting the performance of the PIXcel3D detector in 2D mode in terms of resolution, field of view/detector caption angle, dynamical range and time resolution
This application note describes the possibilities of the PIXcel3D detector for micro-diffraction experiments. The PIXcel3D detector offers the flexibility to choose the experimental conditions between maximizing the intensity (capture angle) and optimizing for resolution. Due to fast response times and high sensitivity real-time experiments can be performed like e.g. in situ studies of re- crystallization processes.
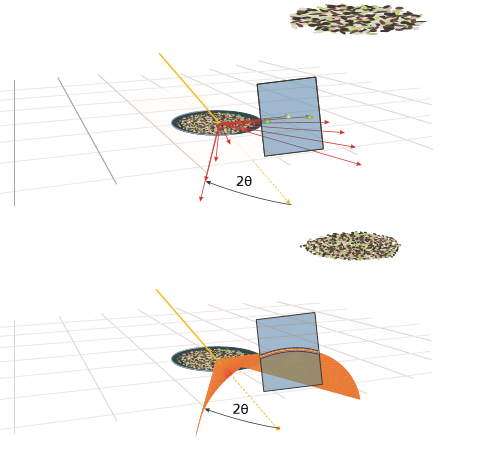
In a polycrystalline sample, only those grains that have the right orientation to the incident beam will meet Bragg’s law and generate a diffracted beam. In micro-diffraction experiments, these diffracted beams originate from a small spot and fan out around the incident beam direction forming a cone with half angle 2theta. The 2D detector intercepts the cone of diffracted rays. An arc is formed on the detector. This arc is called a Debye ring. Even if there are very few crystals diffracting and isolated spots are observed the spots due to diffraction by the same set of planes will be positioned on the ring.
Depending on the crystallite size, the rings can be anything between smooth and spotty, with a single crystal being the most extreme case. Other information that can be obtained from Debye rings is preferred orientation of the crystallites, and the presence of residual stresses.
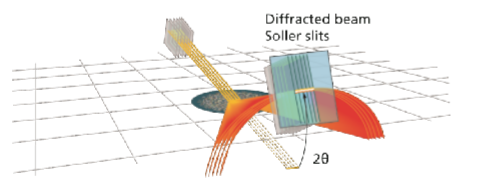
In conventional powder diffraction experiments, where larger incident beams are being used, only the top part of the Debye rings is selected by using Soller slits.
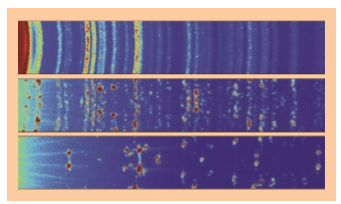
2D micro-diffraction images obtained on the Empyrean showing Debye rings characteristic of sugar grains. From top to bottom: fine, medium and coarse grained samples.
In the experimental setup for micro- diffraction, a narrow beam is created with the incident beam optics which forms a small illuminated area on the sample (e.g. monocapillaries or double crossed slits).
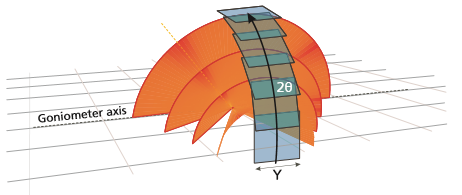
The incident beam angle is measured with respect to the sample surface. There are many possibilities for optics and sample stages depending on the type of sample. The diagrams shown here illustrate the reflection mode for a large (opaque) sample. It is also possible to perform micro-diffraction in transmission, on thin transparent samples, or samples in capillaries. The angle between the incident beam direction and the detector center is recorded as 2θ for each frame. The distance between the sample and detector can be varied to optimize for intensity and angular range at small radius or high resolution at large radius.
As the detector is scanned it intercepts all of the available diffraction cones. Just like in normal powder diffractometry, the resolution of the reflection smoothly changes as a function of 2theta. Alternatively, one can put the detector on a stationary 2theta position and record 2D frames as a function of time, sample condition or temperature.
In scanning measurements, the information from the 2D frames is summed up as a function of 2theta to provide a 2theta strip file.
By integrating along the arcs in the strip file, one can obtain a conventional one-dimensional measurement, which can be used for further analysis, e.g. in HighScore (Plus).
Compared to the traditional Bragg- Brentano geometry, micro-diffraction measurements using a 2D detector generally suffer from a limited resolution. This is mainly due to the limited resolution of the 2D detectors being commonly used. The PIXcel3D, however, is a solid-state pixel detector with small pixel size and a point spread function that is virtually zero. In this example, the resolution of the micro-diffraction geometry with the PIXcel3D detector is determined using NIST SRM660a LaB6 powder placed on a zero-background holder
In this experiment, the detector is placed on the standard position (240 mm away from the goniometer center). Double crossed slits were used in the incident beam. The data has been recorded in 2D scanning mode.
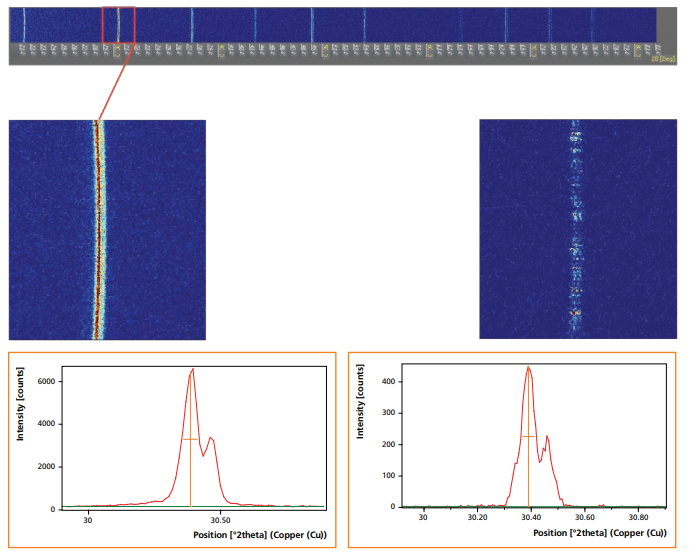
The top graph shows a 2D scan from 20 to 80 degrees 2theta, displaying several LaB6 reflections. On the left- hand side, a zoom-in of the trace of the (011) reflection of LaB6 is shown. An integration along the Debye ring is shown in the screen capture below. The full width at half maximum (FWHM) of the Kα1 peak is only 0.0510.
The image on the right-hand side shows the influence of the combination of narrow beam size and no sample spinning: the reflections of individual crystallites now become visible. Also in this case, an integration along the ring yields a reflection with well-split alpha-1 and alpha-2 components. A resolution like this, is generally not observed in 2D micro-diffraction instruments. Thanks to the solid-state detection technology in the PIXcel3D detector, this performance is now possible with a robust, maintenance- free area detector.
The disadvantage of placing the detector at a large distance from the sample is of course the reduced field of view. In this experiment, the detector- to-sample distance was set to 55 mm. Again, a 2theta/omega scan was carried out, and the PIXcel3D detector was again used in 2D scanning mode.
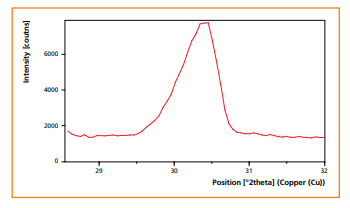
In this mode, the field of view of the detector is improved to more than 14 deg. A significantly larger fraction of the Debye ring can now be observed. The features near 30 deg 2theta close to the top and the bottom of the strip are attributed to single-crystal reflections from the Si zero-background plate.
On the right-hand side, a zoom-in on the reflection at 30.4 deg 2theta is shown, as well as an integration along the Debye ring.
These examples illustrate the range of possibilities for experimental design. By using a small radius and a medium sized beam, high intensities and larger segments of the Debye rings can be observed. Increasing the radius and reducing the beam size increases the resolution
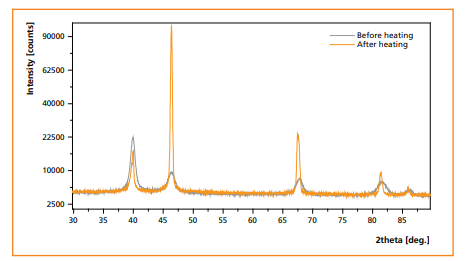
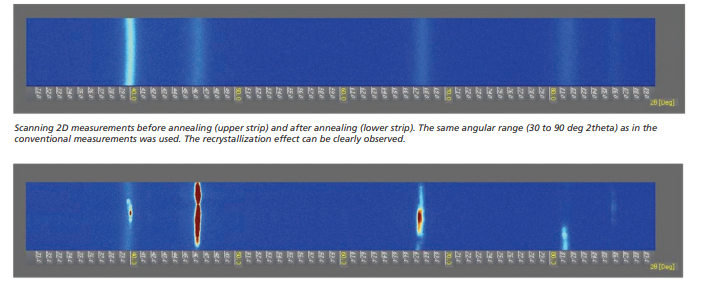
In this example, a sample of nanocrystalline PdAu alloy was placed in an Anton Paar TTK 450 non-ambient chamber. For the 2D measurements, as incident beam optics a double crossed slits PreFIX module was used with openings set to 1.5 mm x 1.5 mm. The PIXcel3D was mounted on a radius reduction interface bringing the detector to a distance of 155 mm from the sample. Conventional 1D scanning measurements (below) show that after heating the diffraction peaks are sharpened, indicating an increase in grain size. The scanning 2D measurements (opposite page) however, show much clearer how the grains have been formed. Additionally, the crystallization process could be followed in situ real-time by recording static 2D images while changing the temperature.
Conventional diffraction profiles before (grey line) and after annealing (orange ) at 180 °C.
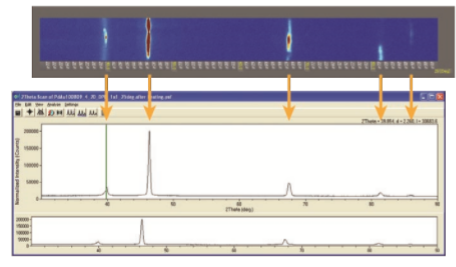
In addition to the scanning measurements before and after the annealing process, the PIXcel3D detector was used in static mode to observe the development of one reflection over time during annealing. The eight frames displayed below were taken from a 2 minutes series of snapshots of 2 seconds each. The temperature was ramped up from 165 to 225 °C while measuring. One can clearly observe the grain formation process as a function of time.
The PIXcel3D detector allows diffractionists to switch from conventional 1D to scanning and static 2D measurements without having to switch to a different detector or instrument. In the 2D mode, one can freely optimize between resolution and field of view simply by varying the detector-to-sample distance. Thanks to the solid-state detection technology, these changes can be made without the need for calibration by the user. The very high dynamical range of the detector allows measurements near the direct beam without the need of a direct beam stop.