SAXS measurements were performed on a set of nanoparticle size reference materials from NIST. The experimental data acquired with ScatterX78 were analyzed with the EasySAXS software to determine the nanoparticle size distributions. All results were found to be precise and accurate, and in good agreement with the values given by NIST. Additional tests on multi-modal particle size distributions demonstrated the power of the indirect Fourier transformation approach for data analysis.
SAXS measurements were performed on a dilute solution of glucose isomerase. By using ScatterX78 experimental data could be acquired with good sensitivity and within short measurement times. The EasySAXS data analysis software was used to deduce information about the size, compactness, overall shape and aggregation behavior of the protein molecules. All results were found to be consistent and in good agreement with what has been reported in the scientific literature.
Micelles are formed by the self-assembly of amphiphilic molecules in a liquid medium. They have important technological applications e.g. in the detergent and pharmaceutical industries. As their application properties are closely related to their structure, control over and determination of the micellar structure is of utmost importance. SAXS is an ideal analytical technique for that purpose as it can be applied in situ and yields information not only about the size of the aggregates, but also about their internal structure and shape. On the other hand, due to the weak scattering signal involved, this can only be done with advanced SAXS instrumentation.
SAXS data were acquired on the Empyrean platform configured with ScatterX78 in combination with a focusing X-ray mirror and the PIXcel3D used as a line detector. Sodium dodecyl sulfate (SDS) was dissolved in a 30 mM aqueous KCl solution to a concentration of 1.0 wt.%. The sample was loaded in a disposable quartz capillary and measured under ambient conditions. For the background measurement the capillary filled with the pure dispersion medium was used. Data reduction and analysis was done with the EasySAXS software.
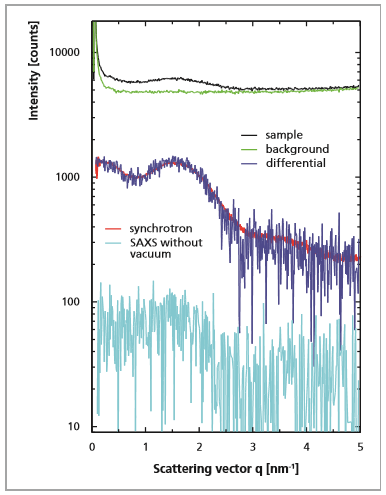
From Figure 1 it is evident that the excess scattering intensity due to the presence of the micelles is extremely small. This is inherently due to their low concentration and small electron density contrast, making it challenging to separate the weak signal from the background. Meaningful data can only be obtained when counting statistics are good and with the background due to any parasitic scattering optimally suppressed. The background-corrected scattering curve obtained with ScatterX78 within only 30 minutes already shows distinct features that are in good agreement with synchrotron SAXS data [1]. The comparison also demonstrates the very good small-angle resolution that can be achieved. On the other hand, when measuring the same sample using a typical SAXS configuration without evacuated beam path and a point detector, too noisy data are obtained - even with a measurement time of several hours. For such weakly scattering samples it is essential to use an evacuated beam path and a low-noise line detector.
Figure 1. Sample and background measurements with ScatterX78 (30 min). The dark blue line is the differential scattering curve. Also shown are results from a measurement (8 h) without an evacuated beam path (light blue) and from a synchrotron SAXS experiment (red).
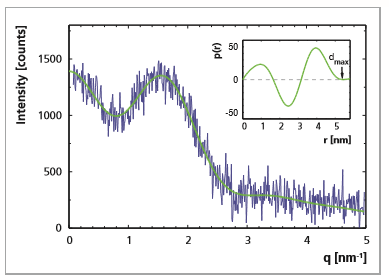
By applying an indirect Fourier transformation on the experimental data, the corresponding pair distance distribution function p(r) could be determined. It contains the real space information of the scattering curve. Its characteristic shape points to a core-shell structure with a negative electron density contrast of the core, and a positive contrast of the shell. It is also in good agreement with what has been reported in the scientific literature [2]. The maximum dimension dmax of the micelle can be estimated from the point where p(r) levels off at zero.
Figure 2. The inset displays the deduced pair distance distribution function p(r). In the main graph the scattering curve back-transformed from the p(r) function is compared with the experimental data, which were found to be in good agreement.
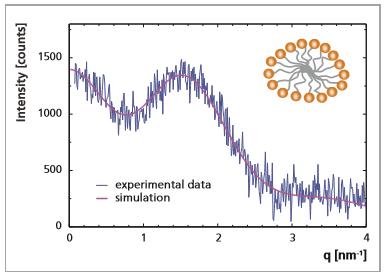
The experimental data could be fitted using the model of a prolate core-shell ellipsoid. The fit parameters are consistent with the known chemistry of the sample: the low-density core of the micelles is formed by the hydrocarbon chains of the surfactant molecules whereas the shell is occupied by the electron-rich, hydrophilic headgroups. They are also in good agreement with those reported in the scientific literature [2] based on experimental data that were acquired on a dedicated SAXS instrument.
Figure 3. The experimental data compared with the result from a fit based on the model of core-shell ellipsoids. The inset shows the deduced aggregate structure of the micelles.
[1] The EMBL beamline X33 (storage ring DORIS-3, DESY, Germany). Courtesy of Prof. D. Svergun (EMBL, Hamburg). For the comparison the original synchrotron data were smeared with the instrumental resolution functions of ScatterX78 and scaled to the same intensities.
[2] J. Narayanan et al, J. Coll. Interf. Sci. 328 (2008), 67-72, and further ref. given therein.
The Empyrean platform with ScatterX78 is well suited for SAXS measurements on weakly scattering samples. The good sensitivity and small-angle resolution is achieved by using an evacuated beam path with focusing optics and advanced beam conditioning elements, combined with a zero-noise solid state line detector.