
This study demonstrates that Zetium is capable of providing accurate results for the analysis of FeCr alloys prepared using the fused bead method. Compared to classic analytical methods, XRF offers a competitive advantage with short throughput time, making Zetium highly suitable in process control environments, especially in combination with a fusion sample preparation machine.
Ferrochrome is the most widely used ferroalloy. It is a very common practice to determine the chemistry of ferroalloys by ‘wet chemistry methods’. However, this technique involves high labor costs and it requires long sample preparation and analysis time. X-ray fluorescence spectroscopy is an excellent alternative technique, offering easy routine sample preparation and high throughput. However, the analysis of pressed pellets and loose powders presents imitations in precision, due to severe metallurgical as well as particle size effects. To overcome these problems, Malvern Panalytical has developed a method to analyze ferroalloys as fused beads, eliminating in this way metallurgical and particle size effects.
Ferroalloys are important components in metals production with iron and steel smelters as the leading customers. Ferrochrome - an alloy containing between 50 and 70% of Chromium - is the most widely used ferroalloy, especially for the production of stainless steel with chromium content between 10 and 20%. It is a very common practice to determine the chemistry of ferroalloys by ‘wet chemistry methods’. However, this technique involves high labor costs and it requires long sample preparation and analysis time. X-ray fluorescence (XRF) spectroscopy is an excellent alternative technique, offering easy routine sample preparation and high throughput. However, the analysis of pressed pellets and loose powders presents limitations in precision, due to severe metallurgical as well as particle size effects. To overcome these problems, Malvern Panalytical has developed a method to analyze ferroalloys as fused beads,
eliminating in this way metallurgical and particle size effects. Compared to classic methods, results are equivalent or better in accuracy and precision, with the advantage of gaining time. This data sheet demonstrates the performance of the fused bead method using XRF.
This study was performed using a Zetium spectrometer configured to perform wavelength dispersive XRF analysis. It is a fully integrated system equipped with a 4 kW Rh-anode SST tube, X-Y sample handler and state-of-the-art SuperQ software, featuring an advanced Fundamental Parameters algorithm. The Zetium is engineered for excellence in terms of analytical accuracy, precision as well as operational performance.
13 ferrochrome certified reference materials (CRM) from different standardization bureaus were used to set up an application for the analysis of major and minor elements in FeCr alloys. Samples were prepared as fused beads of 0 40 mm by mixing 0.2 g of CRM with oxidizing agents and finally fused with lithium borate flux using an Eagon 2 automatic fusion machine. For each sample, 9 elements were measured in less than 10 minutes using a 37 mm collimator mask.
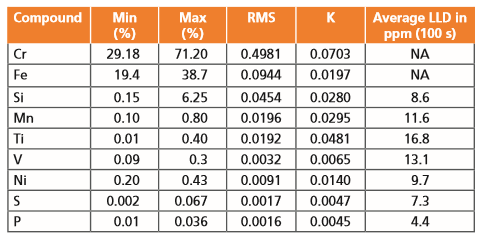
Measurements performed show good results for all major, minor and trace elements analyzed. Figure 1a and b show calibration lines for Cr, Si, S and P obtained for fused beads, each reporting its RMS and K value. Table 1 gives an overview of the elements with their concentration range, their respective value for the ‘root mean square’ (RMS) error, K factor and the lower limit of detection (LLD), based on a 100 seconds counting time. The RMS (absolute error) and K (relative error) represent the accuracies of the calibration.
Figure 1a. Calibration graphs for elements: Cr, Si
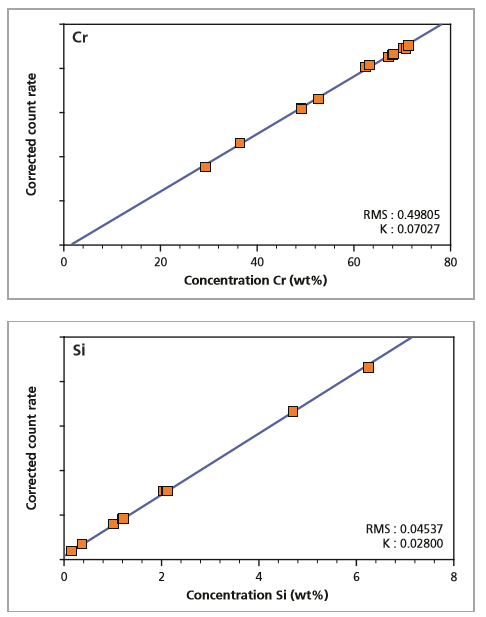
Figure 1b. Calibration graphs for elements: P and Fe
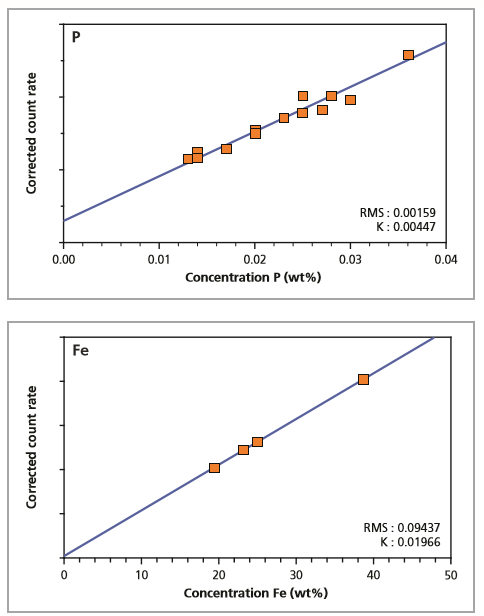
Table 1. Calibration parameters: values for ‘root mean square’ (RMS), K factor and lower limit of detection (LLD)
The K factor is a weighted residual error and is a measure of the differences between the measured concentration and the supplied, certified chemical concentration:
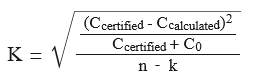
Where C0 is a concentration, generally taken as 0.1% mass percentage, n is the number of standards used in the calibration and k is the number of constants calculated (e.g. intercept, slope, line overlap). As a general rule, K factors ranging from 0.01 to 0.05 indicate accurate calibrations.
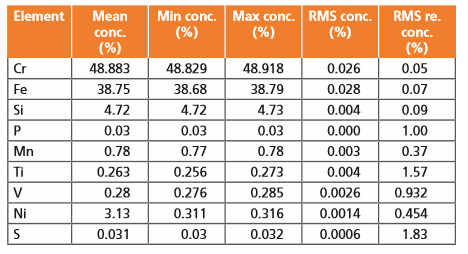
In order to evaluate the stability of the instrument, one monitor sample was used to show measurement repeatability. Results are reported in Table 2 and show how twenty repeated measurements on one instrument are within statistical error.
Table 2. Instrument stability - results of 20 repeated measurements for a control sample
This study demonstrates that Zetium equipped with a 4 kW power tube is capable of providing accurate results for the analysis of FeCr alloys prepared using the fused bead method. Compared to classic analytical methods, XRF offers a competitive advantage with short throughput time, making Zetium highly suitable in process control environments, especially in combination with a fusion sample preparation machine.