Although there are more than ten known chromium minerals, only one is a source of commercial importance. This mineral is known as chromite and has the theoretical composition FeCr2O4 containing 68 % of chromic oxide (Cr2O3), in which the proportions of Mg2+, Fe2+ and Cr3+, Al3+, Fe3+ may vary considerably.
The main product generated by chromite is ferrochrome, a major player in the steel industry. In particular the stainless steel industry uses more than 90 % of the world’s chromite output. The mining and steel industries must assess the quality of the chromite ore to optimize the grade of their stainless steel production. As a result, the chemical analyses of the chromite ore as well as its final and waste products are mandatory. Metal analysis traditionally uses AA or ICP-OES to measure the metal contents in the ores and industrial products. However, the traditional dissolution method for chromite and ferrochrome is a multi-step, multi-acid digestion which requires the use of HNO3, HF and HClO4 and can take between 1 to 3 hours.
Knowing the risks associated with the use of HF and HClO4, many laboratories look for alternative methods to obtain full dissolution of their samples while optimizing their uptime and productivity. As will be demonstrated, sodium peroxide fusions are a quick, safe and efficient alternative for the dissolution of these specific samples.
Although there are more than ten known chromium minerals, only one is a source of commercial importance. This mineral is known as chromite and has the theoretical composition FeCr2O4 containing 68 % of chromic oxide (Cr2O3), in which the proportions of Mg2+, Fe2+ and Cr3+, Al3+, Fe3+ may vary considerably[1].
The main product generated by chromite is ferrochrome, a major player in the steel industry[2]. In particular the stainless steel industry uses more than 90 % of the world’s chromite output. The mining and steel industries must assess the quality of the chromite ore to optimize the grade of their stainless steel production. As a result, the chemical analyses of the chromite ore as well as its final and waste products are mandatory. Metal analysis traditionally uses AA or ICP-OES to measure the metal contents in the ores and industrial products. However, the traditional dissolution method for chromite and ferrochrome is a multi-step, multi-acid digestion which requires the use of HNO3, HF and HClO4 and can take between 1 to 3 hours[3,4].
Knowing the risks associated with the use of HF and HClO4, many laboratories look for alternative methods to obtain full dissolution of their samples while optimizing their uptime and productivity. As will be demonstrated, sodium peroxide fusions are a quick, safe and efficient alternative for the dissolution of these specific samples.
Peroxide fusions can be performed either manually or with automated systems. Although both methods are efficient, the automated systems have the advantage of increasing productivity, improving safety, maintaining repeatable preparation conditions, avoiding spattering as well as cross-contamination. In this project, fusions were performed using a Claisse® Peroxide™ Fluxer (Figure 1).
The Claisse® Peroxide™ Fluxer is a 6 position gas Fluxer specifically designed to do multiple and repetitive peroxide fusions with excellent repeatability and reproducibility. It’s special design and finish makes it optimal to endure repetitive exposure to the aggressive environment generated by peroxide fusions. Combined with the specially designed high-stability burners, the Peroxide™ fluxer offers stable temperature allowing for controlled fusions.
Different samples and reference materials were used to validate the developed method (Table 1).
| Sample | Supplier |
|---|---|
| Certified Reference Material - FeCr (SRM 64c) | NIST |
| Certified Reference Material - Chromite ore (SARM 8) | Mintek |
| Certified Reference Material - FeCr slag (SARM 77) | Mintek |
| FeCr sample | Mining industry |
| Chromite ore sample | Mining industry |
| FeCr slag sample | Stainless steel industry |
In a zirconium crucible, 0,2 g of finely ground sample at less than 100 μm was mixed with 0.5 g of Sodium Carbonate (Na2CO3) and 3,0 g of Sodium peroxide (Na2O2). The crucible containing the mixture was placed on the Claisse® Peroxide™ Fluxer, fused at 560ºC for 3,5 minutes, then cooled by the fluxer fans for 4 minutes.
The cooled zirconium crucible was then placed in a funnel over a 250 mL volumetric flask. Around 10 mL of warm (70ºC) ultra-filtered deionized water is added to the crucible followed by 25 mL of HNO3. The dissolution reaction takes less than a minute after which time the crucible is tipped over and rinsed out with deionized ultra-filtered water. 25 mL of HCl is then added in the flask, then brought up to volume with diluted acid, and brought to the ICP-OES for analysis.
The measurements were performed using the PerkinElmer® Optima™ 7300 DV ICP-OES instrument (Figure 2). It is equipped with the WinLab32™ for ICP Version 4,0 software. On this particular instrument, the ICP torch is mounted in a horizontal orientation in the instrument’s shielded torch box, but can be viewed either axially or radially.
A Scott Spray Chamber with a Gem Tip Cross Flow Nebulizer (Figure 3) was selected as an introduction system because of its proven reliability, robustness and capability to handle high dissolved solids. The viewing mode is user-selectable on an element-by-element basis. A shear gas flow (compressed air) eliminates the cool plasma tail and allows a direct observation of the plasma’s normal analytical zone, thus minimizing chemical matrix effects when the axial-view mode is employed.
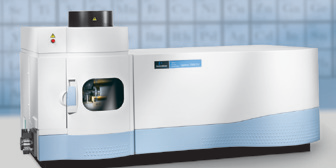
Figure 2. PerkinElmer® Optima™ 7300 DV ICP-OES
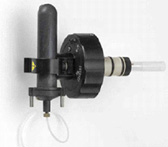
Figure 3. Scott Spray Chamber with Gem Tip Cross Flow Nebulizer
By combining a SCD detector and an Echelle optical system, the Optima™ 7300 DV ICP-OES can measure all the wavelengths simultaneously. Its wavelength flexibility allows the end users to easily add new elements or wavelengths as their program changes. Another benefit of using the Optima for fusion samples includes a 40 MHz free-running solid state RF generator designed to operate between 750 to 1500 W in 1 W increments. High RF power is required to generate a robust plasma, essential for precise analysis of high matrix samples such as fusion samples[4] (refer to Table 2 for detailed Optima™ 7300 DV operating parameters).
| Nebulizer | Gem Tip Cross flow |
| Spray chamber | Scott |
| Injector | Alumina |
| RF | 1500 W |
Argon Flow rate | Plasma: 16.0 L/min
|
| Shear gas | 100 psi |
| Sample flow rate | 1.0 mL/min |
The following criteria were taken into consideration in selecting the wavelength: (a) the freedom from spectral interferences; (b) the different sensitivities and expected concentration in the samples. The most sensitive line was not always used in order to avoid spectral interferences and to remain in the linear range. Observed interferences were compensated for by modifying the processing parameters (e.g. adjusting the background correction points, applying multi-component spectral fittings (MSF) or inter-elemental corrections (IEC)).
Method detection limits (MDLs) were based on ten replicate measurements of a series of low concentration or diluted sample solutions. The MDL was calculated by multiplying the standard deviation of the ten replicate measurements by 3[5]:
MDL = 3 x S10 x CDF
Where: S10 = Std Deviation of the ten replicates
CDF = Corrected Dilution Factor
Table 3 demonstrates analytes of interest with selected wavelengths, viewing modes and method detection limits (MDL).
| Element | Wavelength | Viewing mode | MDL (mg/Kg) |
|---|---|---|---|
| Al | 394,401 | Axial | 63 |
| Ca | 315,887 | Axial | 1000 |
| Co | 228,616 | Axial | 38 |
| Cr | 283,563 | Radial | 250 |
| Cu | 224,700 | Axial | 25 |
| Fe | 238,204 | Radial | 375 |
| Mg | 279,077 | Radial | 63 |
| Mn | 257,610 | Radial | 25 |
| Ni | 231,604 | Axial | 125 |
| P | 178,221 | Axial | 125 |
| S | 180,669 | Axial | 625 |
| Si | 212,412 | Radial
| 63 |
| Ti | 334,940 | Axial | 63 |
| V | 290,880 | Axial | 5 |
The accuracy and precision of the method was evaluated. The accuracy were determined by calculating the elemental recovery of certified reference materials (CRMs). The precision was determined by preparing and measuring 10 replicates of the various CRMs. The results for each CRM are presented in Tables 4, 5 and 6. The accuracy and precision obtained demonstrates that the developed method performed very well.
| Element | Wavelength | Average Experimental values (%) n=10 | Certified values (%) | Accuracy (%) | Precision (%) |
|---|---|---|---|---|---|
| Al | 394,401 | BDL | - | - | - |
| Ca | 315,887 | BDL | - | - | - |
| Co | 228,616 | 0,05 | 0,05 | 107 | 2 |
| Cr | 283,563 | 69,03 | 68,0 | 102 | 23 |
| Cu | 224,700 | BQL | 0,005 | (60) | (15) |
| Fe | 238,204 | 25,87 | 24,98 | 104 | 3 |
| Mg | 279,077 | BDL | - | - | - |
| Mn | 257,610 | 0,16 | 0,16 | 101 | 2 |
| Ni | 231,604 | 0,43 | 0,43 | 100 | 2 |
| P | 178,221 | BQL | 0,02 | (86) | (7) |
| S | 180,669 | BDL | 0,07 | - | - |
| Si | 212,412 | 1,28 | 1,22 | 105 | 3 |
| Ti | 334,940 | BQL | 0,02 | (63) | (5) |
| V | 290,880 | 0,15 | 0,15
| 102 | 2 |
| Element | Wavelength | Average Experimental values (%) n=10 | Certified values (%) | Accuracy (%) | Precision (%) |
|---|---|---|---|---|---|
| Al | 394,401 | 5,81 | 5,56 | 105 | 2 |
| Ca | 315,887 | BQL | 0,19 | (90) | (18) |
| Co | 228,616 | 0,03 | - | - | 4 |
| Cr | 283,563 | 35,50 | 33,5 | 106 | 2 |
| Cu | 224,700 | BDL | - | - | - |
| Fe | 238,204 | 15,20 | 14,13 | 108 | 2 |
| Mg | 279,077 | 8,98 | 8,86 | 101 | 2 |
| Mn | 257,610 | 0,21 | - | - | 2 |
| Ni | 231,604 | 0,15 | - | - | 3 |
| P | 178,221 | BDL | 0,004 | - | - |
| S | 180,669 | BDL | 0,03 | - | - |
| Si | 212,412 | 2,12 | 2,01 | 106 | 2 |
| Ti | 334,940 | 0,14 | 0,14 | 95 | 2 |
| V | 290,880 | 0,07 | 0,08
| 90 | 2 |
In parenthesis and italic = informative values BDL = below detection limit
Corrected dilution factor = 1250 BQL = below quantification limit
| Element | Wavelength | Average Experimental values (%) n=1 | Certified values (%) | Accuracy (%) | Precision (%) |
|---|---|---|---|---|---|
| Al | 394,401 | 15,34 | 14,55 | 105 | 5 |
| Ca | 315,887 | 2,48 | 2,60 | 95 | 2 |
| Co | 228,616 | BQL | - | - | (8) |
| Cr | 283,563 | 9,39 | 8,55 | 110 | 3 |
| Cu | 224,700 | BDL | - | - | - |
| Fe | 238,204 | 5,98 | 5,31 | 113 | 4 |
| Mg | 279,077 | 13,94 | 13,86 | 101 | 2 |
| Mn | 257,610 | 0,16 | - | - | 2 |
| Ni | 231,604 | BQL | - | - | (7) |
| P | 178,221 | BDL | - | - | - |
| S | 180,669 | 0,17 | (0.32) | (54) | 5 |
| Si | 212,412 | 12,81 | 12,5 | 102 | 2 |
| Ti | 334,940 | 0,36 | - | - | 1 |
| V | 290,880 | 0,06 | - | - | 2 |
In parenthesis and italic = informative values BDL = below detection limit
Corrected dilution factor = 1250 BQL = below quantification limit
| Element | Wavelength | #771 (%) | #775 (%) | #784 (%) | SRM 64c (%) | SARM 8 (%) | SARM 77 (%) |
|---|---|---|---|---|---|---|---|
| Al | 394,401 | 101 | 96 | 109 | 101 | 99 | 92 |
| Ca | 315,887 | 96 | 109 | 99 | 114 | 97 | 112 |
| Co | 228,616 | 103 | 101 | 99 | 98 | 102 | 100 |
| Cr | 283,563 | 107 | 105 | 107 | 107 | 108 | 103 |
| Cu | 224,700 | 99 | 89 | 94 | 99 | 101 | 98 |
| Fe | 238,204 | 110 | 107 | 108 | 107 | 103 | 101 |
| Mg | 279,077 | 102 | 97 | 94 | 91 | 94 | 93 |
| Mn | 257,610 | 105 | 104 | 108 | 105 | 107 | 110 |
| Ni | 231,604 | 109 | 112 | 110 | 96 | 102 | 100 |
| P | 178,221 | 114 | 57 | 113 | 96 | 84 | 106 |
| S | 180,669 | 97 | 95 | 107 | 110 | 66 | 86 |
| Si | 212,412 | 102 | 53 | 106 | 91 | 105 | 91 |
| Ti | 334,940 | 107 | 105 | 106 | 105 | 103 | 102 |
| V | 290,880 | 105 | 105 | 105 | 99 | 103 | 97 |
Peroxide fusions combined with the simultaneous ICP-OES (Optima™ 7300 DV) have the analytical capabilities to perform the analysis of chromite ore, ferrochrome and chromium slag samples with good accuracy, precision and speed of analysis. The analytical method developed was robust and fulfills the requirements normally set for the analysis of high matrix samples such as fusion samples. Metal components were measured at low and high concentrations in a variety of samples and reference materials, demonstrating good accuracy. The sodium peroxide fusion approach to dissolution of chromite ore, ferrochrome and chromium slag samples is an excellent alternative to other harsh, incomplete and time consuming acid digestions.
1. http://minerals.usgs.gov/minerals/pubs/commodity/chromium/chrommcs06.pdf, Papp, John F. "Mineral Commodity Summary 2006: Chromium". United States Geological Survey.
2. Determination of major and minor elements in ferroalloys by inductively coupled plasma atomic emission spectrometry, J. Anal. At. Spectrom., 1988, 3, 1101-1103 Authors: M. Vaamonde, R. M. Alonso, J. García and J. Izaga
3. Analysis of Ferroalloys by Atomic Absorption Spectrometry, Applied Spectroscopy, Vol. 24, Issue 6, pp. 576-579 (1970) Authors: D. C. Smith, J. R. Johnson and G. C. Soth
4. Trace Metal Characterization of Soils using the Optima 7300DV ICP-OES, PerkinElmer® Inc., Application Note, Author: Praveen Sarojam, PhD.
5. Protocole pour la validation d'une méthode d'analyse en chimie, Centre d'Expertise en Analyse Environnementale du Québec, Ministère de l'Environnement, Document de référence DR-12-VMC, Édition courante, 21 pages.