
The phase diagram of trehalose was studied using the PIXcel3D 2x2 detector in combination with a temperature controlled humidity system. The large field of view of the detector (10.4° when the detector is placed at 155 mm from the sample) allows to visualize differences in the structural properties of different phases.
In this data sheet the structural properties of different trehalose polymorphs have been investigated. A set of measurements at different humidity and temperature conditions were performed using the PIXcel3D 2x2 in combination with a temperature controlled humidity chamber (Anton Paar CHC plus+).
In this data sheet the structural properties of different trehalose polymorphs have been investigated. A set of measurements at different humidity and temperature conditions were performed using the PIXcel3D
The structural properties of different trehalose polymorphs were monitored using the 2D capabilities of PIXcel3D 2x2. The detector was placed at 155 mm from the sample on an Empyrean diffractometer resulting in an angular field of view of 10.4°. The sample was ground and placed into a standard sample holder for the CHC plus+ chamber. Before measurements, the sample was dried at 2-3% relative humidity and 50°C for one hour. Incident beam optics used are double crossed silts collimator, with a beam size of 0.7x0.7 mm2 and the X-ray tube in point focus.
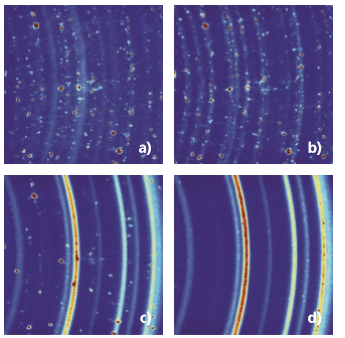
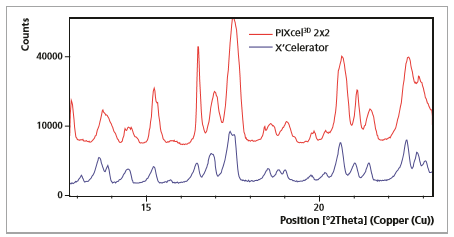
Figure 1 shows four different 2D diffraction patterns collected at the different positions (a, b, c, d) in the phase diagram shown in Figure 2. The measurement time for each pattern was 2 minutes. When increasing the temperature at 40% humidity, see Figure 1.b-c-d), there is a conversion from the phase Th to Tβ. 1D XRD would also show the conversion between these two phases, see for example Figure 3, however the 2D pattern contains additional information on the structural properties of the
trehalose phases. The Th phase presents fewer larger crystallites, resulting in the small intense diffraction spots. On the contrary, the phase Tβ is made of smaller crystallites, randomly oriented, resulting in the continuous diffraction rings.
The phase diagram of trehalose was studied using the PIXcel3D
Figure 1. Diffraction pattern of trehalose collected at different °C and different % relative humidity, showing two trehalose phases (Th and Tβ), which have different texture. The letters a,b,c and d correspond to the phase diagram in Figure 2.
The 2D data complements the higher resolved 1D pattern obtainable using the same detector in Bragg-Brentano geometry. Information such as the structural properties of the different phases is easily visualized in the 2D data, whilst the 1D data are more suitable for quantitative analysis of the ratio between the different phases.
Figure 2. The graph indicates the different conditions at which the 2D diffraction patterns were collected. Additional information about the properties of the different phases (e.g. preferred orientation) is easily obtainable.
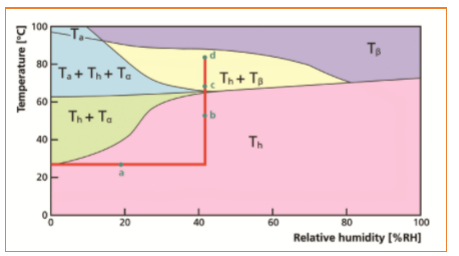
Figure 3. 1D data collected with an X’Celerator (in blue) and obtained from the 2D data collected with the PIXcel3D
2D capabilities of the PIXcel3D 2x2 allow to get significantly more information about a sample under study, especially in the case of high texturing. With the 2D data sets the crystallization process can be visualized and thus give additional information on top of the highspeed 1D data sets that are typically obtained in Bragg-Brentano geometry.