This technical note summarizes the preparation of samples suitable for the measurement of absolute molecular weight using static light scattering on the Zetasizer Nano and µV instruments. It uses a polystyrene molecular weight standard sample as an example of the procedures involved to obtain suitable samples for successful molecular weight measurements. However, other suitable samples can be prepared using the guidelines contained in this document.
| Weight of Polystyrene Molecular Weight Standard (mg) | Weight of Toluene (g) | Final Sample Concentration (mg/mL) |
|---|---|---|
| 1.5 | 2.6 | 0.499 |
| 3 | 2.6 | 0.998 |
| 4.5 | 2.6 | 1.497 |
Prepare 3 different concentrations of the polystyrene molecular weight standard in toluene by accurately weighing appropriate amounts of powder and toluene into the cuvettes and stopper them to prevent any solvent evaporation. It is easier to weigh toluene and use its density value of 0.865kg/m³) to calculate the volume of solvent used. Recommended sample concentrations to be prepared are 0.5, 1.0 and 1.5mg of polystyrene molecular weight standard per mL of toluene respectively. Guidelines for the preparation of appropriate concentrations of molecular weight standard are shown in table 1
Allow the samples to stand for 1 hour to ensure complete solubilization of the polymer in the solvent.
Perform a sizing measurement on each concentration to check for modality and the presence of any dust or aggregates. Ideally, the sample should consist of a single peak. If not, the sample needs to be prepared again. Measure the various sample concentrations using DLS to check if dilution influences the size.
If the sample quality is good then a molecular weight measurement can be performed.
Use the "Polystyrene in toluene molecular weight.sop" supplied with the Zetasizer software to measure the samples.
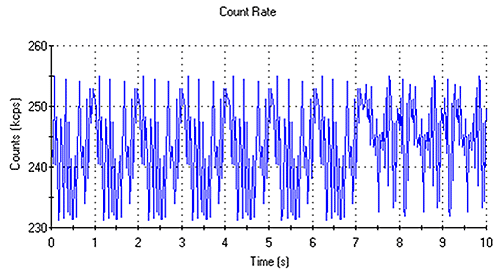
The count rate traces obtained should be fluctuating with time over a narrow range of intensity values. This is indicative of a sample free of large particles, aggregates or dust. Figure 1 shows a typical count rate trace of a suitable sample for molecular weight measurement.

|
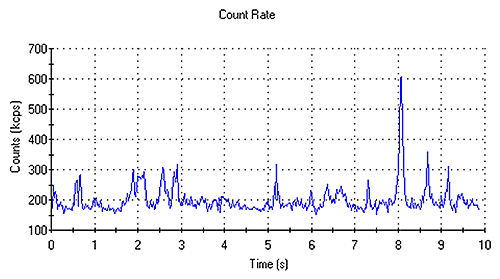
"Spikes" in the count rate trace indicate the presence of dust and/or aggregates and will result in poor data quality and poor molecular weight results. Figure 2 shows a typical count rate trace obtained from a sample containing aggregates. If such data is obtained, the samples will need to be filtered and re-measured. Filtration of a sample will result in a loss of material and the correct concentration of the sample will need to be determined.

|
For protein samples, the measurement of the absorbance at a suitable wavelength will allow for concentration determination using the protein's extinction coefficient at that wavelength. For polymer solutions which are not chromophores, the determination of concentration is more difficult and a suitable refractometer is required.
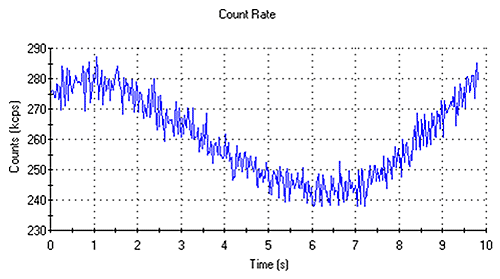
Cycling of the count rate trace indicates that the sample is not thermally equilibrated (Figure 3). In such circumstances, a longer equilibration time should be defined in the SOP.

|
The intensity of scattered light obtained from each sample concentration should increase linearly. This can be checked from the Debye plot shown on the Molecular Weight report supplied with the Zetasizer software. If the intensity does not increase linearly with sample concentration, then the samples will need to be prepared again and the measurements redone.