
Brominated flame retardant polymers are used to elevate the ignition temperature of polymers in order to make them safer for applications like clothing, electronics and textile. Brominated polystyrene is the most common flame retardant polymer produced.
A similar product exists in the case of surface modified polymers. These specialty polymers are finding more uses replacing conventional polymer, for example the surface fluorination of polymers allows the polymer to inherit the structural properties of the base polymer while having the inertness of a fluorinated polymer.
In both cases the change in the structure of the base polymer may be hard to quantify and the fluorination and bromination process may change the polymer structure, giving different properties of the final product.
This application communication shows how triple detection gel permeation chromatography (GPC) is used to quantify the bromination of polystyrene showing the molecular weight increase, the polymer size remaining the same in this case and the density increasing after bromination.
Samples of linear polystyrene and brominated polystyrene were analyzed using a Viscotek triple detection array (TDA) gel permeation chromatography system. The triple detection system is similar to a conventional GPC system where the sample is injected onto a column that separates the sample mixture based on the size of the molecule, not their molecular weights. While the conventional calibration system will be calibrated with known molecular weight (MW) standards to construct a calibration curve, triple detection uses a light scattering and a viscometer in addition to the traditional RI (differential refractometer) detector to obtain extra information. The use of the light scattering (LS) detector allows the measurement of the absolute molecular weight of the sample independently of the elution time. The differential viscometer is used to measure the intrinsic viscosity of the sample as the detector signal is proportional to the inverse density of the molecule and concentration. Together the LS and the viscometer detector's signal can be combined to calculate the hydrodynamic radius (Rh) of the molecule and to plot the Mark-Houwink graph allowing density and branching assessments.
|
|
|
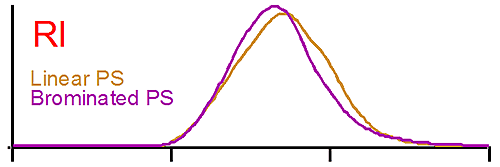
Figure 1 shows the raw detector signals for linear polystyrene (brown curve) and for brominated polystyrene (purple curve). The traces at the top of figure 1 show the RI signal for both polystyrene (PS). The RI signal is proportional to the polymer concentration, the dn/dc having been taken into account. In this case both PS concentrations are similar, a result verified by the software. We note that the elution volume is the same for the linear and the brominated species. A conventional GPC system would detect both polymers as having the same molecular weight when compared to the calibration curve since both are eluting at the same time.
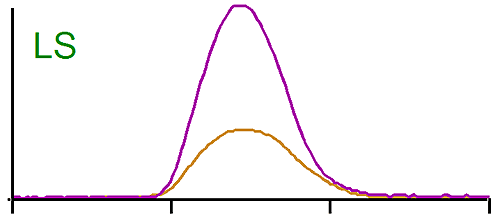
The middle trace in figure 1 is the raw signal from the light scattering detector. In this case also the peaks are eluting at the same time, but the brominated species gives a larger signal than the linear one. Since the light scattering signal is proportional to the concentration and the molecular weight, we are expecting the molecular weight of the brominated PS to be higher. Note here also the dn/dc was taken into account as the differential refractive increment is different for the linear and the brominated samples. The results calculated by the OmniSEC software are presented in Table 1.
It shows indeed that the weight average molecular weight (Mw) of the brominated samples is more than twice the Mw of the linear PS.
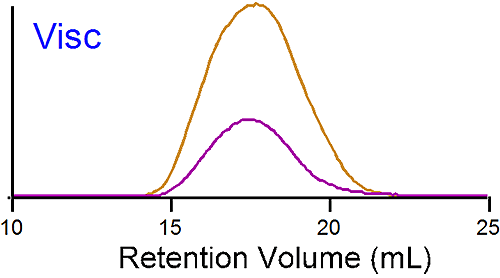
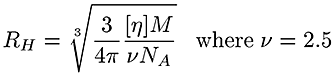
The traces at the bottom of figure 1 are from the viscometer detector. In this case the brominated sample shows a lower intrinsic viscosity ([η]) than the linear one. Table 1 reports an average intrinsic viscosity of 0.87 for the linear compared to 0.26 dL/g for the brominated PS. Using the Stokes-Einstein equation, the average hydrodynamic radius are calculated from both Mw and [η] to be 15 and 14 nm for the linear and brominated samples respectively, explaining the elution profile being very similar for both PS.
Linear Polystyrene | Brominated Polystyrene | |
|---|---|---|
Mw (g/mol) | 250 000 | 620 000 |
[η] (dL/g) | 0.87 | 0.26 |
Rh (nm) | 15 | 14 |
|
|
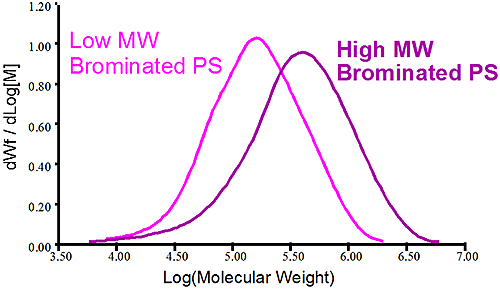
Figure 2 shows the molecular weight distribution of two different batches of brominated polystyrene. The first sample shows a high molecular weight brominated PS in purple while the pink trace shows a lower molecular weight brominated PS. It is obvious that both samples have different molecular weight but conventional measurements showing the distribution is not telling why there is a difference between the two. Is it a different level of bromination of the two samples that created the different MW or is it a difference of the original PS before bromination? In this case the viscometer is used to verify the bromination level of the two samples. Since the viscometer signal is proportional to the inverse density of the sample, different densities are expected for different bromination level. The Mark-Houwink (MH) plot is constructed by taking the intrinsic viscosity measured by the differential viscometer and plotting it against the absolute molecular weight measured by the light scattering detector, the graph is on a log-log scale.
|
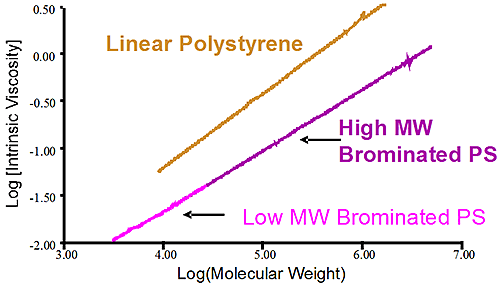
Figure 3 is the Mark-Houwink graph showing the linear polystyrene having a distinct higher density than the two brominated species. The two brominated samples are on the same straight line in the MH plot indicating the same degree of bromination for both the lower molecular weight and higher molecular weight brominated polystyrene samples. The difference between the two batches of brominated PS came from the stock unbrominated polystyrene used. Another conclusion can be drawn from the fact that the slopes of the pure linear sample of polystyrene and the brominated ones are similar. The parallel slopes indicate that the uptake of bromine is the same, proportionally, for the low MW and high MW end of the distribution. Finally the linear nature of the slopes in the MH plot indicate linear polymer without any branching.
Using triple detection gel permeation chromatography it was possible to determine that the polystyrene was brominated although the size, and hence the elution profile, did not change significantly. It was also possible to obtain the average hydrodynamic size of both linear and brominated species. The unique use of the viscometer and light scattering detectors allowed us to draw the conclusion that two batches of different PS were used to produce two batches of brominated PS and the bromination level was constant on the two batches. The bromination was showed to be the same across the distribution. No branching occurred during the bromination.