The ability to automate particle size and scattering intensity trend measurements can be a major advantage in many applications. Processes such as aggregation, sedimentation, solubilization and changes in molecular conformation can be followed by monitoring changes in the size and scattering intensity of the sample. The Zetasizer Nano range has the capability of automating the measurement of particle size and scattering intensity as a function of temperature or time. This application discusses the trend measurements options with application examples.
Time trend measurements, where the particle size and scattering intensity is plotted as a function of elapsed time, are useful for following processes such as particle aggregation, sedimentation, creaming or solubilization. Information on the kinetics of such processes can be obtained from these measurements.
The Zetasizer Nano range of instruments incorporates non-invasive backscatter (NIBS™) optics. The scattered light is detected at an angle of 173°. This optical configuration gives high sensitivity for the measurement of small, weakly scattering molecules such as proteins and polymers. In addition, NIBS™ minimizes multiple scattering effects and therefore also enables the measurement of highly turbid, concentrated samples.
Measurements of a protein that undergoes polymerization were made on a Zetasizer Nano S instrument.
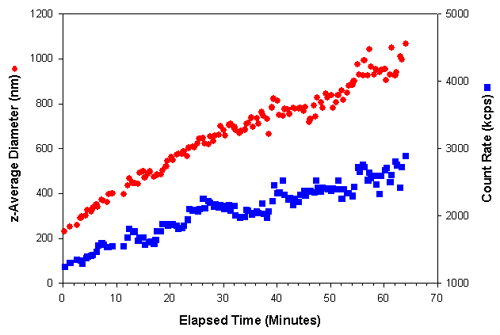
Measurements of 20 seconds duration were taken over a period of over an hour. Figure 1 shows the z-average diameter (the mean diameter based upon the intensity of scattered light) and the count rate (in kilo counts per second (kcps)) obtained as a function of the elapsed time after a polymerizing initiator was added to the protein sample. As the protein underwent polymerization to larger particles, an increase in the intensity of scattered light was observed. The effect of various inhibitors on this process could be studied by monitoring changes in the rate of size and/or scattering increases.
|
Temperature trend measurements enable for the size and scattering intensity to be monitored as a function of temperature. The Nano series has built in temperature control over the range of 0° to 90°C. A temperature trend measurement can be set up to cover defined limits and increments. Equilibration time at each temperature is also user definable. Phase transitions of various materials can be studied using these automated temperature trend measurements. The presence of any hysteresis phenomena can be determined through such measurements.
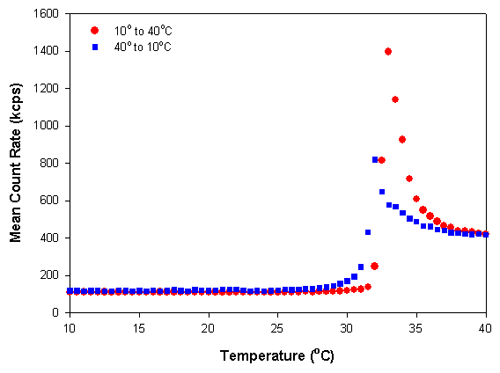
Figure 2 shows the scattering intensity versus temperature trend plot of the polymer sample poly(N-isopropylacrylamide) (PNIPAM). This polymer exhibits a reversible, temperature-dependent phase transition that is attributed to alterations in the hydrogen bonding of water molecules to the amide group of the side chain [1-4]. The temperature at which this occurs is known as the cloud point or lower critical solution temperature (LCST) [1,2]. At temperatures below the LCST, PNIPAM is soluble and the polymer has an open, random coil conformation. Above the LCST, the polymer chains collapse into a globule and produce a more compressed particle with a higher refractive index.
|
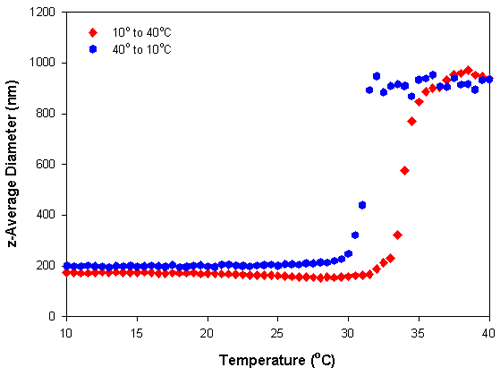
Figure 2 shows the results obtained for a temperature trend measurement from 10°C to 40°C and then the reverse measurement from 40°C to 10°C of a 0.01% w/v PNIPAM solution in deionized water at 0.5° increments. A delay time of 5 minutes was used at each temperature to ensure that the sample viscosity was equilibrated before the measurements were taken. Figure 3 shows the z-average diameters obtained from the temperature trend measurements. The large changes in the mean count rates and z-average diameters at temperatures around 32°C is indicative of the lower critical solution temperature and is consistent with previously published LCST values for PNIPAM [3]. The data shows that there is slight hysteresis in the phase transition of PNIPAM, which is more pronounced in the particle size results compared to the scattering intensity values. The range of values observed covers the range of reported values in the literature [1-4].
|
[1] Schild, H.G. (1992) Prog. Poly. Sci. 17, 163-249.
[2] Wu, C. and Zhou, S. (1996) Phys. Review Lett. 77, 3053-3055.
[3] Ottaviani, M.F., Winnik, F.M., Bossmann, S.H. and Turro, N.J. (2001) Helv. Chim. Acta 84, 2476-2492.
[4] Wu, C. and Wang, X. (1998) Phys. Rev. Lett. 80, 4092.