Suspension nasal spray products typically contain an active pharmaceutical ingredient (API) along with other excipients. The ability to obtain API-specific particle size data for these formulations is an important part of production Quality Control. Manual analysis of Light Microscopy images is commonly employed to perform this task. However, separating API particles from excipient particles can be qualitative and subjective. The Morphologi® is a fully automated instrument designed to capture microscope images of dispersed particles and quantitatively analyze them for size and shape. In this application note, we demonstrate how to expedite a QC method for Nasal Spray formulations and ensure consistent analysis of repeated measurements.
A nasal spray drug product contains an active ingredient and often other excipients dissolved or suspended in a formulation which is delivered to the patient by nasal inhalation. Delivery by such a method is common for drugs to alleviate, for example, sinus congestion or allergic rhinitis or to deliver vaccines, proteins and peptides. Typically, the formulation is administered via a metered spray pump activated by the patient.
When producing such sprays, pharmaceutical manufacturers are required to ensure Quality Control (QC) procedures are followed. Guidance for such procedures are outlined by the Centre for Drug Evaluation and Research (CDER) "Guidance for Industry" documents entitled “Bioavailability (BA) and Bioequivalence (BE) Studies for Nasal Aerosols and Nasal Sprays for Local Action”1 and “Nasal Spray and Inhalation Solution, Suspension, and Spray Drug Products - Chemistry, Manufacturing, and Controls Documentation”2.
One important parameter that is controlled is the droplet size delivered by the spray pump. This is often measured by laser diffraction methods. Additionally, for some nasal spray formulations, QC procedures must also be carried out to characterize the active pharmaceutical ingredient. Such QC procedures may specify the proportion of large active particles that the sample may contain along with the proportion of smaller active particles, thus the method involves identifying and counting the particles that meet the specified criteria. Often, such procedures are carried out by manual microscopy analysis which can be time consuming, requires a skilled analyst to identify particles that meet the criteria and may be subject to human bias or fatigue.
Automation of such procedures with the Morphologi® not only reduces the analysis time but also frees up the analyst for other tasks and reduces subjectivity.
A manual microscopy analysis currently employed for particle size determination of an API in a nasal spray involves the analyst identifying 500 API particles in a sample whilst ensuring they are not touching any excipient particles. Digital images of these particles are taken and independent image analysis software is used to size the particles and provide statistics. The QC procedure specifies that no more than 2 % of the active particles can be larger than 10 µm in terms of Circular Equivalent Diameter (CE Diameter). Additionally, 70 - 95 % of the particles are required to be between 1 and 7 µm in terms of CE Diameter. For each batch tested two samples are required to be measured. The time to complete the analysis is around 2 hours for an experienced analyst. Automating such a procedure on the Morphologi not only reduced the analysis time to around 20 minutes, but it also allowed the identification of over 3800 active particles; significantly improving the statistical significance of the analysis.
The samples were dispersed in the same way as detailed in the specification for the manual analysis, thus a sample of the nasal spray was sprayed onto a glass slide and a coverslip was placed on top. The sample was measured on the Morphologi according to a standard operating procedure (SOP), which defined all the hardware and software variables such as the sample area to be measured. Classifications were set up to identify active particles in the required size classes so the proportion in each could be established. Post analysis of any images of API particles that were touching excipient particles, were excluded from the final result. Each measurement took around 20 minutes and identified over 3800 active particles. Increasing the sample area measured would increase the number of particles identified even further. Figure 1 shows a classification chart representing the proportion of API particles found in each size class including example particle images.

|
When developing the method for the automated analysis, the scattergram function of the Morphologi software was employed to help define the particle classifications. Here, a morphological parameter and a range or limit are set to include particles that meet those criteria, e.g. CE Diameter >1 and <7 µm. A classification may include multiple parameters each with range or limit criteria. A particle must meet all criteria to be included in the classification. In this study, three classes were set at different CE Diameter size ranges, Intensity Mean limits and Aspect Ratio limits (table 1). Using the scattergram feature, each class could then be compared against other morphological parameters in order to check for a correlation.
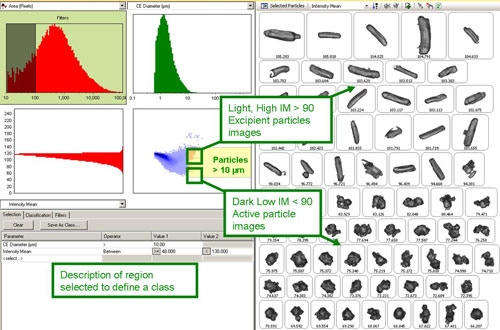
Figure 2 shows a screen shot of the scattergram feature. The top left distribution allows interactive filtering; the example shows that all particle images containing less than 100 pixels are excluded from the result since at least 100 pixels per image are required for meaningful shape information. The top right and bottom left distributions show size or shape parameters as selected by the user. In this example, the top right distribution shows CE diameter and the bottom left distribution shows the mean intensity. The scattergram in the bottom right graph then shows the relationship between these two morphological parameters.
|
From the scattergram, it was found that for particles larger than 10 µm the intensity mean parameter separated the dark API particles from the light excipient particles (Figure 2). On selecting a region of the scattergram, only particle images contained within that region are displayed. The region can then be resized as required to include only particle images of interest. The parameters selected can then be used to define a new class or redefine an existing one, if required. Once classes are established they can then be added to the SOP to be generated at the end of the measurement. The classifications applied in the SOP used here are detailed in Table 1.
| Size class | Class description. |
|---|---|
| >10µm | CE Diameter (µm) > 10.00
Intensity Mean < 90.0 |
| 7-10µm | CE Diameter (µm) ≥ 7.00 and < 10.00
Intensity Mean <= 90.0 |
| 1-7µm | CE Diameter (µm) ≥ 1.00 and < 7.00
Intensity Mean <= 90.0 Aspect Ratio > 0.500 |
The same SOP may then be run on multiple samples and compared by combining the results in a classification chart or in a classification table.
Performing Quality Control procedures that require the identification of certain types of particles by manual microscopy, for example, on nasal spray suspensions, require highly skilled analysts and can be time consuming and open to subjectivity or bias. Automating such procedures on the Morphologi not only removes the subjectivity, it also frees up the analyst for other tasks and allows methods to be easily transferred between sites without the need for intensive training.