Additive Manufacturing (AM) is a term used to describe advanced production methods that convert a 3D model into a real part by the layer upon layer addition of material. Compared to traditional subtractive methods, AM is ideal for rapid prototyping and can enable the faster, cheaper and more efficient production of complex parts such as customized medical components or engine parts, often with improved strength and durability.
As illustrated in Figure 1, Powder Bed Fusion (PBF) processes involve the controlled application of a thin layer of powder, followed by the use of a thermal source such as a laser to selectively fuse the powder particles together. This is repeated for each layer and the finished part is then extracted from the powder cake. The unused powder can then be recycled for the next part, usually by blending it with a certain amount of virgin powder. Thermoplastic polymers such as polyamide 12 (known commonly as nylon 12 or PA12) are well suited for PBF processes as they can be processed reliably due to their semi-crystalline nature providing a distinct melting point.
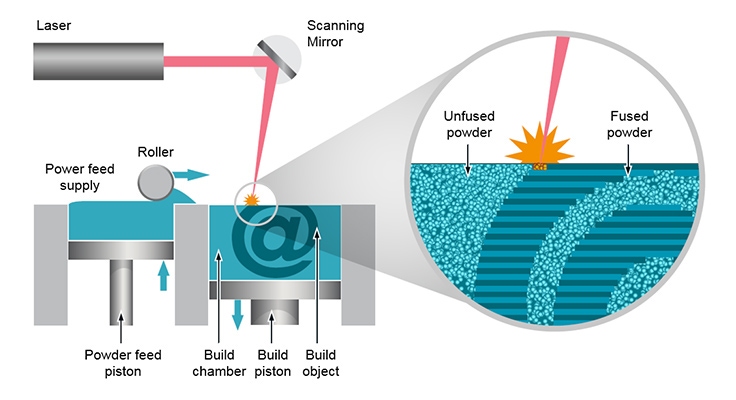
Figure 1. Diagram showing a typical Powder Bed Fusion (PBF) process
The ability to recycle unused powder gives PBF processes the potential to be very resource-efficient, but this efficiency depends strongly on the condition of the recycled powder, as it risks a deterioration in final part quality. This Application Note looks at how size exclusion chromatography (SEC), which determines the macromolecular characteristics of the feed material, and automated image analysis, which provides morphological information for the particles, can provide valuable insights to this active area of research.
Additive Manufacturing (AM) is a term used to describe advanced production methods that convert a 3D model into a real part by the layer upon layer addition of material. Compared to traditional subtractive methods, AM is ideal for rapid prototyping and can enable the faster, cheaper and more efficient production of complex parts such as customized medical components or engine parts, often with improved strength and durability.
Powder Bed Fusion (PBF) processes such as Selective Laser Sintering (SLS) were among the first AM processes to be commercialized.[1] As illustrated in Figure 1 PBF processes involve the controlled application of a thin layer of powder, followed by the use of a thermal source such as a laser to selectively fuse the powder particles together. This is repeated for each layer and the finished part is then extracted from the powder cake. The unused powder can then be recycled for the next part, usually by blending it with a certain amount of virgin powder.
Figure 1. Diagram showing a typical Powder Bed Fusion (PBF) process
Materials that can be used in PBF processes include certain metal, polymer and ceramic powders. Thermoplastic polymers such as polyamide 12 (known commonly as nylon 12 or PA12) are well suited as they can be processed reliably due to their semi-crystalline nature providing a distinct melting point.[1] Nylon, particularly nylon 12, has over 90% of the market share[2] thanks to the wide temperature working window between it melting (during heating) and its subsequent crystallization (via cooling).
Nylon 12 is a relatively expensive material that contributes to high build costs, yet in a typical SLS process as much as 85-95% can end up not being sintered.[3] The ability to recycle unused powder gives PBF processes the potential to be very resource-efficient, but this efficiency depends strongly on the condition of the recycled powder, as it risks a deterioration in final part quality. During the PBF process, the powder layer is usually pre-heated close to the melting temperature of nylon 12 (ca. 167°C) – this aids part consolidation and minimizes warpage. However, this ages the polymer powder, causing physical and chemical changes.[3]
Figure 2 provides an overview of the main material characteristics that affect the PBF process, and therefore the quality of the final product. It highlights the relationship between the molecular characteristics of the material used in SLS and the resultant physical and individual particle properties, which in turn influences the bulk powder properties, all of which impact on the SLS processability.
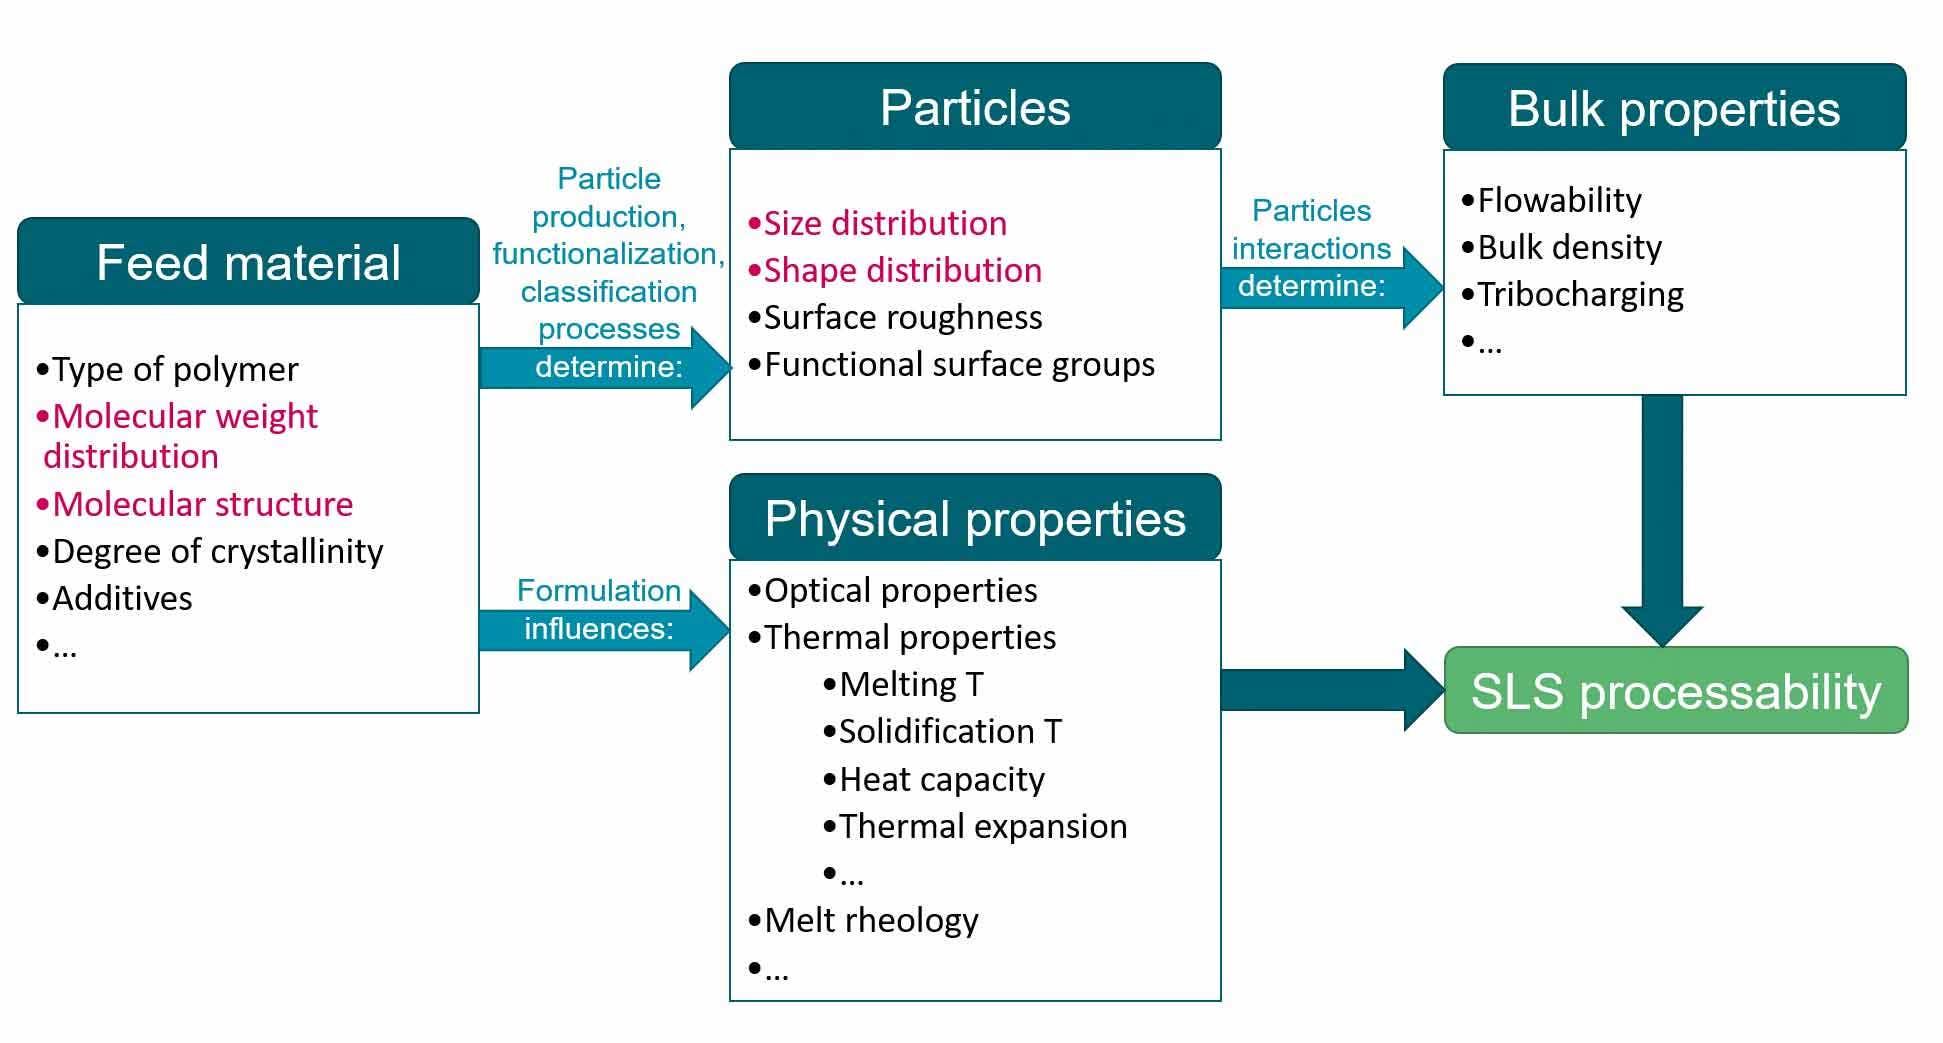
Figure 2. Overview of the key material characteristics that influence processability in SLS. Highlighted in pink the properties covered in this Application Note. Adapted from Reference [4]
A better understanding of how these factors affect, for example, powder reusability for nylon 12 is vital. This Application Note looks at how size exclusion chromatography (SEC), which determines the macromolecular characteristics of the feed material, and automated image analysis, which provides morphological information for the particles, can provide valuable insights to this active area of research.
The Malvern Panalytical Morphologi 4 system (Figure 3 (a)) is an automated static image analysis system that provides statistically relevant particle size and particle shape information, enabling a greater understanding of both sample and process. Through the automated imaging of thousands of particles, the Morphologi 4 delivers both qualitative and quantitative analysis of a powder sample. This is advantageous when considering other popular imaging techniques such as Scanning Electron Microscopy (SEM), where typically only a low number of images are analyzed.
Size exclusion chromatography (SEC) or gel permeation chromatography (GPC) is a liquid chromatography technique that separates macromolecules according to their size (hydrodynamic volume), in order to measure molecular characteristics such as molecular weight and molecular weight distribution, molecular size and structure. The OMNISEC from Malvern Panalytical (Figure 3 (b)) is an advanced multi-detection system comprised of four different detectors: refractive index (RI) and ultraviolet (UV-Vis) detectors, also referred to as concentration detectors, light scattering (RALS/LALS) detector, and viscometer detectors. Thanks to the presence of these detectors a full and detailed characterization of the materials analyzed can be achieved and thus help in understanding the relationship between the materials’ molecular characteristics and its physical properties and behavior during processing or as final products.
![[i_170628_224_mg4_row12.jpg] i_170628_224_mg4_row12.jpg](https://dam.malvernpanalytical.com/3fcf9aa7-d042-4974-a115-b09000ce0358/i_170628_224_mg4_row12_Original%20file.jpg)
![[mkg-omnisec] 636216650008864396YH.png](https://dam.malvernpanalytical.com/ebfb3787-8f3f-4555-816a-ad9d01877a6a/636216650008864396YH_Original%20file.png)
Figure 3. (a): the Morphologi 4 system. (b) the OMNISEC system, comprising OMNISEC RESOLVE (left), OMNISEC REVEAL (right) and OMNISECTM software
The sample analyzed was a commercially available nylon 12 powder. From this, two samples were produced: a portion was analyzed as received (herein labeled Nylon 12-new), while a second portion was subjected to one cycle of the additive manufacturing process and the unused powder, destined to be recycled in the AM process, was collected for analysis (labeled Nylon 12-recycle).
The integrated Sample Dispersion Unit (SDU) was used to disperse the nylon 12 powders onto a glass plate. For each sample, 5 mm3 of powder was dispersed at 2 bar air pressure. Figure 4 shows the Morphologi 4 stage and integrated SDU, with an example dry powder dispersion.
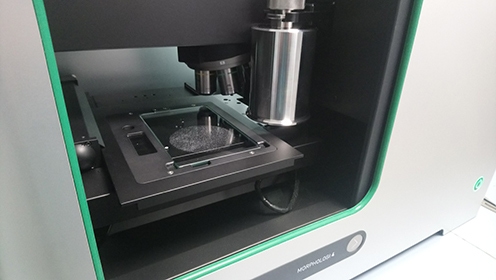
Figure 4. The Morphologi 4 stage and integrated SDU, with an example polymer powder dispersion.
The nylon 12 samples were measured according to a Standard Operating Procedure (SOP) on the Malvern Panalytical Morphologi 4 system, which specified the analysis of a specific area of the dispersion using the Sharp Edge image segmentation method with diascopic illumination and the 5x magnification objective. A solidity < 0.8 filter and a convexity < 0.85 filter were applied to omit touching particles from the analysis. For each analysis >10,000 particles were imaged in approximately 30 minutes. To test method reproducibility the Nylon 12-new and Nylon 12-recycle samples were dispersed and measured in duplicate using the same dispersion conditions and SOP. The two records were then combined in the Morphologi 4 software to give one record per sample.
The nylon 12 samples were measured by multi-detection SEC on a Malvern Panalytical OMNISEC system including RI, UV-Vis, RALS/LALS and viscometer detectors. The OMNISEC system (Figure 3) was set up as follows:
All system control, data acquisition, data analysis and data reporting were performed using the OMNISECTM V11.20 software.
Figure 5 shows the number weighted Circle Equivalent Diameter (CED) distributions for the Nylon-12 new and Nylon 12-recycle powders. Overlaying the number-based distributions (where each particle is counted equally) enables the fine particle fraction to be compared easily for the two samples. It shows that while the distributions are similar, with the main mode centered around 40 µm, the Nylon 12-new sample has a slightly higher fraction of particles with a CED below 10 µm.
This is important because while too many fine particles can negatively impact the flowability of the powder, the smaller particles can help improve the packing density.[5] Having good control over the amount of fines throughout the process aids powder reusability as it means they do not have to be replaced as often (e.g. through blending with new powder).
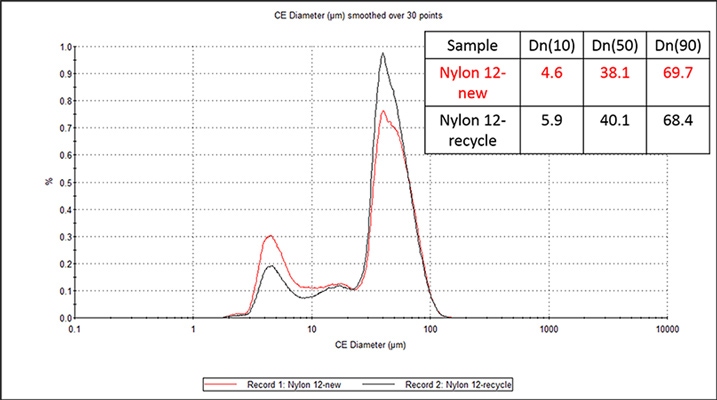
Figure 5. Number weighted circle equivalent diameter (CED) distributions of the Nylon 12-new (red) and Nylon 12-recycle (black) powders. The 10th, 50th and 90th percentiles are also shown.
The overlay of the volume-weighted CED distributions (Figure 6) enables the results to be compared more easily to those from ensemble-based particle sizing techniques such as laser diffraction. It reveals that the powders have a median particle size around 65-70 µm, remaining almost unchanged after one cycle.
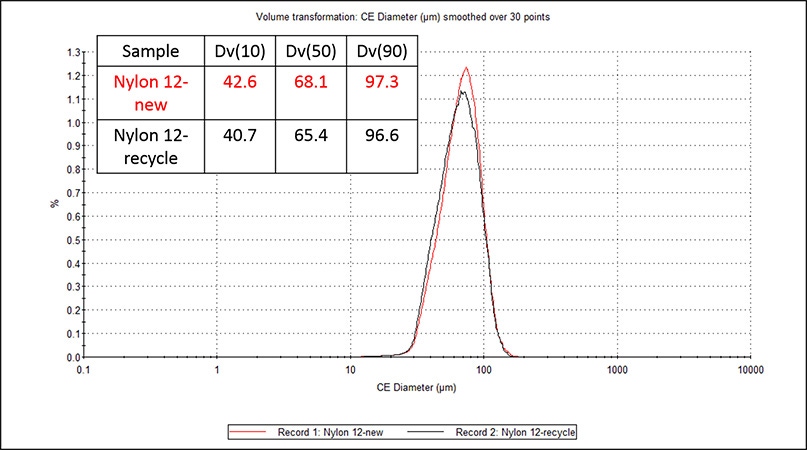
Figure 6. Volume weighted circle equivalent diameter (CED) distributions of the Nylon 12-new (red) and Nylon 12-recycle (black) powders. The 10th, 50th and 90th percentiles are also shown.
To investigate particle shape a filter was applied to both samples to remove particles with a CED smaller than 20 µm so as to just focus on the major mode of particles (see Figure 5).
The parameter variability chart (located in the comparison tab) presented in Figure 7 shows there is little variability in the overall distributions of the morphological parameters across the two samples. The longer the colored bar in the X-axis, the larger the variability of the distribution of that parameter. Overlays of the elongation and High Sensitivity (HS) circularity cumulative undersize distributions are also presented in Figure 7, which show that the Nylon 12-recycle powder is subtly more elongated and less circular than the Nylon 12-new powder.
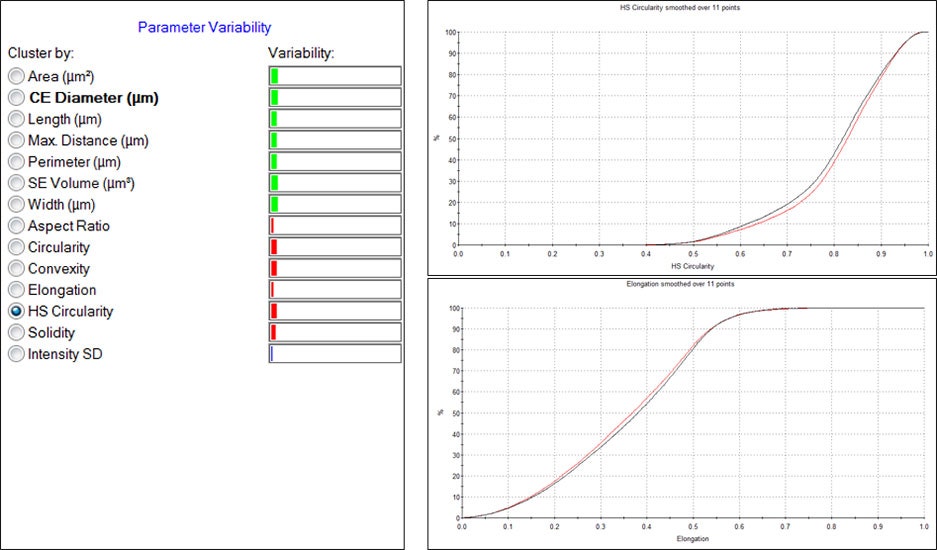
Figure 7. Parameter variability chart comparing the Nylon 12-new and Nylon 12-recycle (CED ≥ 20 µm) samples. The elongation and HS circularity distributions (red line = Nylon 12-new, black line = Nylon 12-recycle) are also shown.
Looking at the particle images (Figure 8) it is clear that the majority of particles have rounded but inhomogeneous shapes, often referred to as potato-shaped, which is typical for precipitated commercial nylon 12 powders.[5] Further examination of the images revealed that some particles were more elongated in shape, as well as the presence of agglomerates.
Using a combination of shape parameters, three classes were set up to group together particles of similar shapes (Figure 8). For example, any particle with an elongation value greater or equal to 0.4 and a solidity value greater than or equal to 0.95 was included in a class named “Elongated.”
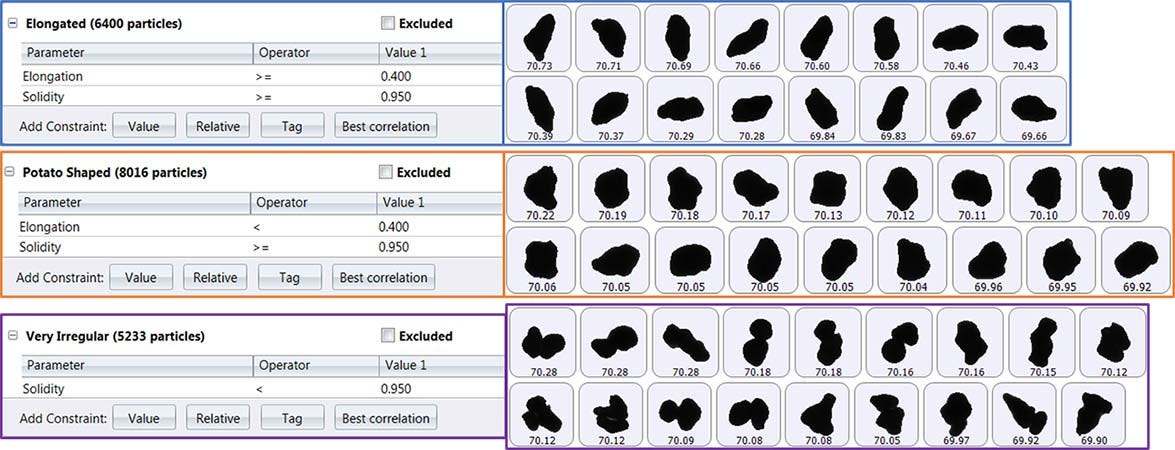
Figure 8. Particle classifications with corresponding example particle images (Nylon 12-recycle shown).
The percentage of particles in each class can then be compared for both the Nylon 12-new and Nylon-12 recycle samples (Figure 9). While the percentage of particles in the three classes are similar for both samples, Nylon-12 recycle appears to have slightly higher proportions of elongated and more irregularly shaped particles. Though these differences are relatively small after one cycle, they may become more pronounced with more cycles, which could affect powder bed formation and subsequent part quality.
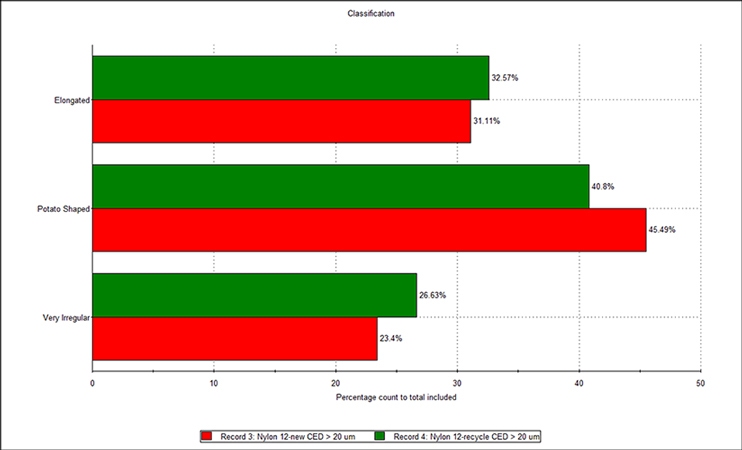
Figure 9. The percentage of total counted particles in each class for Nylon 12-new (red) and Nylon 12-recycle (green) (CED ≥ 20 µm).
Looking more closely at the particle images classed as very irregular, the majority appear to be agglomerates of smaller particles. Particles of interest can be easily returned to (by right-clicking on the particle image in the Morphologi 4 software) and viewed under different conditions. Figure 10 shows two particles from the very irregular class imaged at 20x magnification using episcopic bright field illumination settings. The first appears to be an agglomerate, while the second looks like a single, possibly fused, particle. Being able to differentiate between these particle types can be useful as they could behave differently during the PBF process.
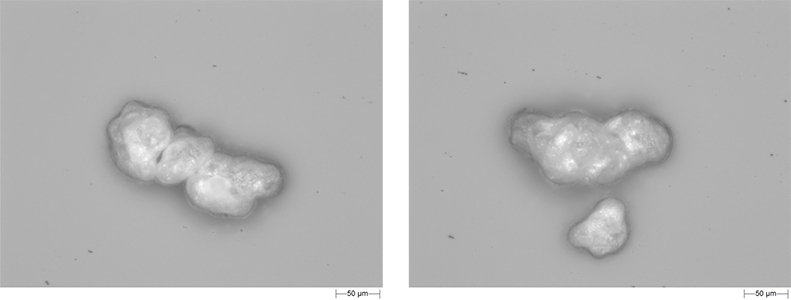
Figure 10. Example field of view Z-stacked images of particles using episcopic illumination at 20x magnification.
The multi-detection chromatograms produced for samples Nylon 12-new and Nylon 12-recycle are shown in Figure 11. In this figure, the refractive index (RI) detector signal is in red, the viscometer signal in blue, the right-angle light scattering (RALS) signal in green, and the low angle light scattering (LALS) in black.
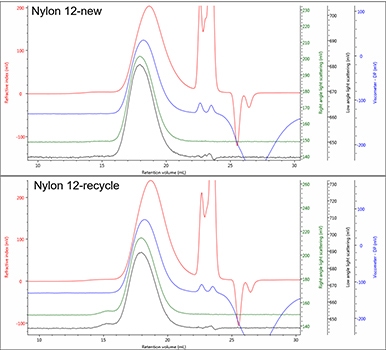
Figure 11. Multi-detection chromatograms of Nylon 12-new and Nylon 12-recycle.
The two chromatograms show both samples’ peaks eluting between 14 and 22 mL of retention volume, and the typical chromatography permeation peaks and negative viscometer peak after 22 mL of retention volume. The two samples show very similar profiles in each detector output.
Repeatable differences between the samples can be observed by overlaying duplicate injections of the samples. In Figure 12, two overlays are shown, one using the RI detector and the other the RALS detector. Note that the RI detector responds to sample concentration while, in addition to concentration, the light scattering detectors (RALS/LALS) and the viscometer (DP) respond to the sample’s molecular weight and intrinsic viscosity respectively.
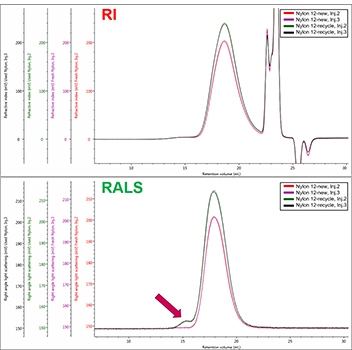
Figure 12. Overlay of the RI and RALS chromatograms for duplicate injections of Nylon 12-new (red and purple) and Nylon 12-recycle (green and black).
Despite the different peak intensities, due mainly to the different samples’ concentrations injected, the RI chromatograms of the samples look very similar. However, in the light scattering chromatogram (RALS) a shoulder at low retention volume (ca. 15mL) can be observed for Nylon 12-recycle only. This shoulder indicates high molecular weight species present in the recycle sample at very low concentrations, as no corresponding peak in the RI is observed. The comparison of the quantitative results attainable from the OMNISECTM software helps to better understand the differences observed between the chromatograms for the two samples.
The quantitative results from the OMNISECTM software are reported in Table 1. An average of three injections of each sample is reported for the molecular weight distribution moments (Mn, Mw, Mz), dispersity (Ð), hydrodynamic radius (Rh), intrinsic viscosity (IV) and recovery.
| Sample ID | Nylon 12-new | Nylon 12-recycle | ||
|---|---|---|---|---|
| Average | %RSD | Average | %RSD | |
| Mw (g/mol) | 51,900 | 0.33 | 56,800 | 0.54 |
| Mn (g/mol) | 30,100 | 0.88 | 32,100 | 0.48 |
| Mz (g/mol) | 77,800 | 3.09 | 89,900 | 1.45 |
| Đ | 1.72 | 1.22 | 1.77 | 0.66 |
| Rh (nm) | 8.78 | 0.92 | 9.04 | 0.33 |
| IV (dL/g) | 0.92 | 0.88 | 0.94 | 0.30 |
| Recovery (%) | 97.1 | 1.22 | 97.5 | 0.09 |
The data reported in the table shows that there is a difference in terms of molecular weight distribution between the two samples. Both number-average (Mn) and weight-average (Mw) molecular weight are slightly higher for Nylon 12-recycle, however, a bigger increase is observed for the Z-average molecular weight (Mz) values. Mz represents the high molecular weight fraction of a sample, as it is an average that is highly weighted towards the molecular mass of each polymer chain. The higher Mz value for Nylon 12-recycle indicates that the sample contains more high molecular weight polymer than Nylon 12-new.
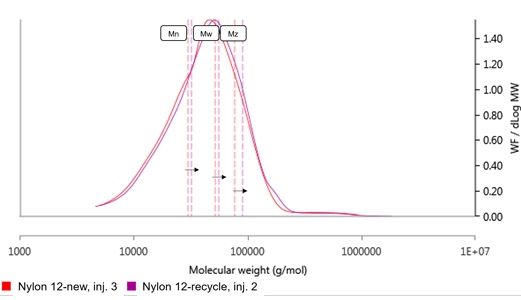
Figure 13. Overlay of molecular weight distribution plots of Nylon 12-new (red) and Nylon 12-used (purple), and the respective molecular weight moments (Mn, Mw, Mz).
Figure 13 shows the molecular weight distributions of the two samples along with the molecular weight moments, which shift toward higher molecular weight values from Nylon 12-new to Nylon 12-recycle. Whilst these differences are small, they indicate that during processing the nylon 12 is subjected to chemical modifications. The presence of higher molecular weight in nylon 12 has been shown in previous studies to affect the quality of final SLS printed parts.[6]
The OMNISEC additionally provides the structural characterization of the samples from the viscometer and light scattering detectors data. The Mark-Houwink plot (M-H) in Figure 14 confirms that the nylon 12 has likely not been affected structurally during the PBF process. The intrinsic viscosity (IV) plots are in fact perfectly overlaying for duplicate injections of the two samples, suggesting the same structure. This behavior was also observed in another study where the M-H plots for nylon 12 samples, used as fresh and recycled material in SLS, remained unchanged suggesting that the polymer chains increase in molecular weight linearly by solid-state polycondensation.[7,8] IV is an inherent parameter of a sample in a solvent and is an indication of the molecular density of the samples. As IV increases, the molecular density decreases. If the samples, chemically equal, are different structurally, for example, due to branching or cross-linking, the IV plots would deviate from each other. The M-H plot thus can play a role in detecting changes, or the absence of changes, in the structure of polymers powder in SLS after repeated recycle processes.
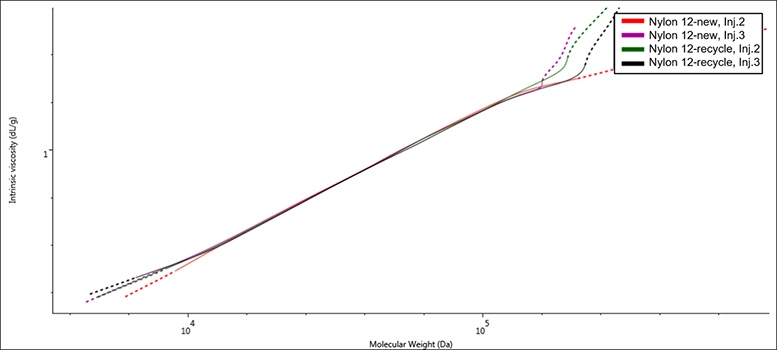
Figure 14. Mark-Houwink plot overlay of samples Nylon 12-new (red and purple) and Nylon 12-recycle (green and black).
The Malvern Panalytical Morphologi 4 and OMNISEC systems have been used to characterize new and recycled nylon 12 powders used in a powder bed fusion process. The Morphologi 4 system provides statistically relevant particle size and shape information, important properties that can influence the spreadability of the polymer powder, while changes to the polymer’s molecular weight and structure can be investigated on the feed materials using the OMNISEC system.
Based on the results in this Application Note subtle differences can be detected between the analyzed Nylon 12-new and Nylon 12-recycle powders after just one cycle of the PBF process, which are expected to become more pronounced after further cycles. These analyses give the manufacturer more control and the potential for cost savings by facilitating a deeper understanding of how many times a powder can be recycled, as well as the optimum powder refresh rate (used/new powder ratio) to use in the process. This helps to ensure the quality of the powder bed, and therefore the quality of the final part is not compromised.