Human serum albumin (HSA) is a globular transport protein synthesized in the liver. It is the most abundant protein in human blood plasma, comprising half of the blood serum proteins. HSA functions primarily as a carrier for hormones and fatty acids. It has been shown to exhibit strong binding to various cations, including Ca2+, Na+, and K+, and is often the transport mechanism for blood based medicinal products.
In addition to its small molecule transport function, HSA also maintains and regulates the oncotic pressure within the blood system, along with the pH. Loss of HSA, can quickly lead to increased vascular permeability, arising from a reduction in oncotic pressure, resulting in swelling of the arteries and veins. As the oncotic pressure is a colligative property, an understanding of the oligomeric equilibrium for HSA is important.
Size Exclusion Chromatograph (SEC) or Gel Permeation Chromatography (GPC) is a common technology used in pharmaceutical laboratories for purification, identification, and quantification of protein mixtures. SEC is a physical method that separates materials based on their size. The elution profile provides insight into the oligomeric components of the mixture and can be interpreted as a size distribution.
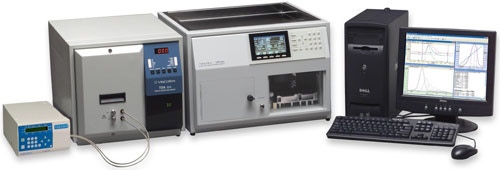
In the study presented here, a Viscotek TDAmax system, equipped with refractive index, light scattering, and viscometer detectors, together with a GE Superdex 200 column, was used to characterize human serum albumin. The fresh HSA protein, with a known molecular weight of 66 kDa, was prepared in 0.1 M PBS at a concentration of 7.5 mg/mL. A 100 μL sample was injected onto the Viscotek system operating at a flow rate of 0.5 mL/min and a temperature of 35 °C.
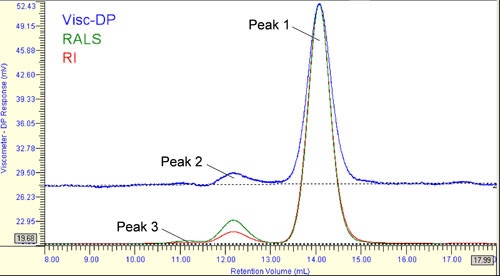
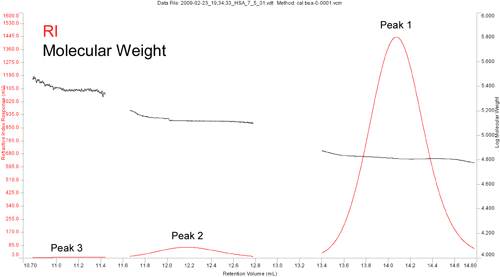
The SEC chromatogram for HSA in PBS is shown in Figure 1, where the Refractive Index (RI) signal is shown in red, the right angle light scattering (RALS) signal is shown in green, and the signal from the differential viscometer is shown in blue. This chromatogram, extracted directly from the Viscotek OmniSEC software, indicates 3 peaks at 14, 12, and 11 mL elution volumes. It is worthwhile to note here, that Peak 3 is not discernable from the baseline in the viscosity trace. The significance of this observation will become relevant in later sections of this report.
|
In SEC, smaller molecules permeate further into the pores of the column packing material. As a consequence, they are retained longer in the column, such that a larger retention volume (or time) indicates a smaller molecule. In the chromatogram shown in Figure 1 then, Peak 1, eluting between 13 and 15 mL, is expected to be the monomer, and Peaks 2 & 3 being higher order oligomeric forms of HSA.
In conventional SEC, the assumption that Peak 1 is the monomer would need to be confirmed by calibrating the column with structurally similar standards of known molecular weight. In multi-detector SEC systems such as the Viscotek TDAmax however, direct measurements of the protein size, molecular weight, and viscosity are attainable, eliminating the need for the time consuming and less direct method of column calibration.
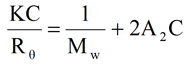
The Rayleigh expression describing the scattering of light from a collection of small molecules in solution is given below, where K is an optical constant, C is the concentration, Mw is the weight average molecular weight, A2 is the 2nd virial coefficient, and Rθ is the angular dependant scattered light intensity.
|
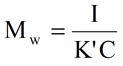
For the dilute conditions inherent to SEC measurements, this expression can be further simplified and rearranged to the form shown below, where K' is the combined optical and Rayleigh Ratio proportionality constants, and I is the residual intensity measured at the light scattering detector.
|
As evident in the above expression, the weight average molecular weight can be calculated directly from the measured scattering intensity, if the sample concentration is known. For multi-detection SEC systems, such as the TDAmax, the concentration is readily available from the refractive index or UV signal.
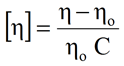
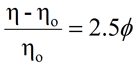
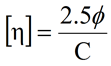
For SEC systems containing a differential viscometer, the concentration from the RI signal can also be used to derive the intrinsic viscosity ([η]). For dilute sample concentrations, the intrinsic viscosity is related to the solution (η) and solvent (ηo) viscosities measured at the viscometer according to the expression shown below, where C is the RI derived sample concentration.
|
Another property that can be derived from multi-detection SEC systems is the hydrodynamic radius by viscosity (RH). Einstein showed that the viscosity of a dilute solution of spheres was related to the volume fraction (φ) of the spheres as shown in the expression below.
|
When coupled with the expression for the intrinsic viscosity, the Einstein equation can be rewritten as:
|
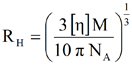
Using the definition of concentration and the spherical volume, the above expression can be further expanded and rearranged as shown below, where M is the molecular weight, NA is Avogadro's number, and RH is the hydrodynamic radius
|
Since the intrinsic viscosity and molecular weight are measured values for samples injected in the TDAmax system, the above equation can be used to calculate the hydrodynamic radius for each of the fractions eluted during an SEC measurement.
Table 1 shows a comparison of the measured size, intrinsic viscosity, and weight average molecular weight values for the 3 peaks in the HSA experiment, along with the mass fraction of each oligomeric form of the protein. The measured molecular weight of Peak 1 is consistent with the reported molecular weight of monomeric HSA of 66 kDa. With a Mw of 137 kDa, Peak 2 is identified as the dimeric form of the protein. The measured Mw of Peak 3 lies roughly midway between the trimer and tetramer forms of the protein.
| Peak 1 | Peak 2 | Peak 3 | |
|---|---|---|---|
| Molecular Weight Mw (kDa) | 66.6 | 136.7 | 242.2 |
| Intrinsic Viscosity - [η] (dL/g) | 0.0298 | 0.0354 | Unresolved |
| Hydrodynamic Radius - RH (nm) | 3.2 | 4.2 | Unresolved |
| Mass Fraction | 94.4% | 5.2% | 0.4% |
| Oligomeric Form | Monomer | Dimer | Trimer/Tetramer |
As proteins tend to form discrete oligomeric structures, the mid range molecular weight value for Peak 3, at first sight, appears to be erroneous. Figure 2 shows a magnification of the RI chromatographic trace, along with the molecular weight values measured across each peak. As evident in this figure, Peak 3 is barely discernible from the baseline, and covers a significant range of Mw values. The mid range value reported then, is likely a consequence of poor chromatographic separation between the trimeric and tetrameric forms of the protein.
|
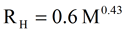
The well known relationship for estimating the hydrodynamic radius of globular proteins from the molecular weight, or vice versa, is given in equation 7. This equation was derived from many protein measurements made by Dynamic Light Scattering (DLS). While the molecular weight and size measurements derived from the Viscotek TDAmax do not require use of this empirical relationship, it is instructive to compare the empirical results with the absolute results measured by the TDAmax. For the monomer, dimer, trimer, and tetramer forms of a 66kDa HSA protein equation 7 predicts hydrodynamic radii values of 3.6, 4.8, 5.7, & 6.5 nm respectively. The predicted hydrodynamic radius values for the monomer and dimer are consistent with those measured with the TDAmax. The slight difference may come from the average weighting used to create the empirical equation 7, which makes all the DLS measurements self consistent. The difference may also come from the treatment of the shape factor for non spherical molecules like HSA, where application of the Simha factor to the Stokes-Einstein equation will result in slightly different values of size being reported.
|
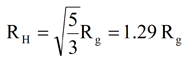
In their work with HSA, Kiselev et al. reported a radius of gyration (Rg) value of 2.74 nm from small angle neutron scattering. According to Schmitz, the radius of gyration can be used to predict the hydrodynamic radius using the relationship for hard spheres shown below. Application of this equation to the 2.74 nm Rg value reported by Kiselev, yields an estimated RH value of 3.5, which, as noted above, is in line with the 3.2 nm RH value measured with the Viscotek system.
|
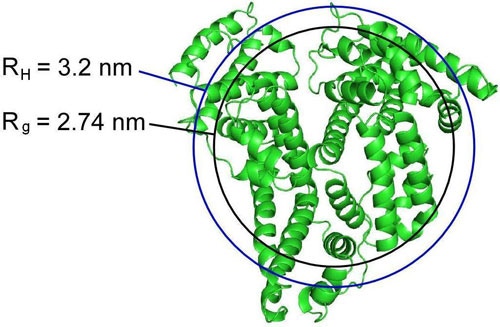
Finally, it is instructive to consider the physical meaning of RH and Rg. The hydrodynamic radius is defined as the radius of a hard sphere diffusing at the same speed as the protein measured. The radius of gyration on the other hand, is defined as the mass weighted average distance from the center of mass to each mass element in the molecule. Note that neither of these definitions is consistent with the general definition of the radius being the distance from the center of the molecule to the outer surface.
Figure 3 shows an overlay of spheres with the radii of RH and Rg values for HSA on a ribbon structure of the protein. As noted in this figure, neither of the experimentally measured radii values is consistent with the radius of a sphere encapsulating the entire protein, although for this protein, the sphere defined by the hydrodynamic radius is approaching this size.
|
Chaubal, M. "Human Serum Albumin as a Pharmaceutical Excipient" Drug Delivery Technology2005, Vol.5 No.8
Human Protein Reference Database [http://www.hprd.org/]
Kiselev, M; Gryzunov Y.; Dobretsov G.; Komarova M. "The Size of Human Serum Albumin Molecule in Solution", Research Institute of Physicochemical Medicine, Moscow, Russia, 2000
Matejtschuk, P.; Dash, C.; Gascoigne, E "Production of human albumin solution: a continually developing colloid" British Journal of Anaesthesia, 2000, Vol. 85, No. 6: 887-895
Roche, M.; Rondeau, P.; Singh, NR.; Tarnus, E.; Bourdon, E." The antioxidant properties of serum albumin" Laboratoire de Biochimie et Génétique Moléculaire, Université de La Réunion, Saint Denis de La Réunion, France. Federation of European Biochemical Societies Letters, 2008 Vol. 582, No. 13:1783-1787
Schaller, J.; Gerber, S.; Kampfer, U.; Lejon, S.; Trachsel, C.; Human Blood Plasma Proteins Structure and Function. John Wiley and Sons, 2008
Schmitz, S.K. "An Introduction To Dynamic Light Scattering By Macromolecules", Academic Press, New York, 1990
|