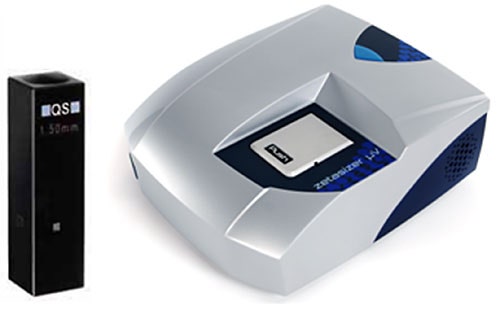
The Zetasizer range of instruments are primarily used for the measurement of molecular and particle size by dynamic light scattering (DLS). They comprise the highest quality components and optical setups to address the maximum range of applications.
The Zetasizer μV is capable of measuring macromolecules, such as proteins, in solution using a 90º measurement angle. The sensitivity allows the instrument to measure a small protein such as Lysozyme at a concentration of just 0.1mg/ml. Furthermore, the 90º measurement angle means that the sample volume can be minimized to just 2μl. This is ideal for proteins, which in the early stages of research, are often only available in very limited quantities.
This application note describes a measurement of 0.1mg/ml Lysozyme in a 2μl sample volume.
Measurements at such low concentrations are challenging, and a number of steps need to be taken to ensure the quality of the data. The first thing to consider is the cell. A quartz cell provides the best optical surface to reduce the contribution of any noise to the overall signal. It must also be absolutely clean and free of any contaminants or dust. Measurements at the lowest concentrations and smallest sizes are easily ruined by contamination of the measurement cell. Such contaminants can take the form of cross-contaminants from previous measurements due to poor cleaning protocols and also from dust or other particles in the sample solution.
|
At such low concentrations, extended correlation times may be required to collect sufficient signal for reliable and repeatable results. In this case, 10 x 200 second sub-runs were used for each measurement.
Multiple sub-runs are pooled together to maximize signal quality. Additionally, dust rejection protocols in the Zetasizer software automatically filter out the sub-runs with the highest count rate, which include the contributions from aggregates or contaminating particles.
The sample itself must be absolutely pure in order to measure the size accurately. Aggregates within the sample can overshadow the signal from the molecule of interest leading to instability in the count rate and difficulties accurately measuring the sample.
Filtration is the preferred method for removing large aggregates and particles from a small sample at low concentration. The 0.1mg/ml Lysozyme was filtered twice through 0.02μm syringe filters to ensure the sample's cleanliness.
To accurately measure the concentration of protein, a UV spectrophotometer should be used. This sample of Lysozyme was measured at 280nm using an extinction coefficient (ε) of 26.5 (A280, 1%). The concentration after filtration was measured to be 0.10mg/ml.
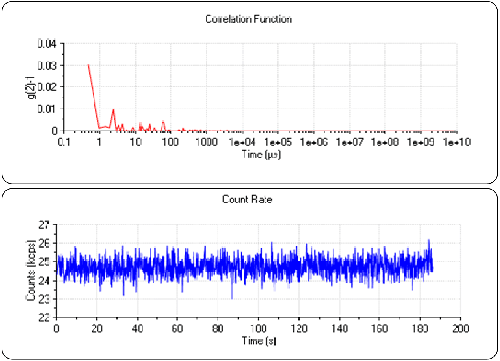
To ensure the cell was clean, measurements were made of pure water before the Lysozyme. A count rate of 24.7kcps was observed. This is typical for clean demineralized water in this instrument. Figure 2 shows a count rate trace and correlogram for water. It can be seen that the count rate is stable over the duration of the sub-run and that the correlation function consists of random noise. This demonstrates that the cell is sufficiently clean for the measurement.
|
The cell was emptied and dried to ensure no sample dilution of the Lysozyme and 2μl was loaded with a pipette. This was done carefully so that the laser did not intersect the meniscus of the sample in the cell.
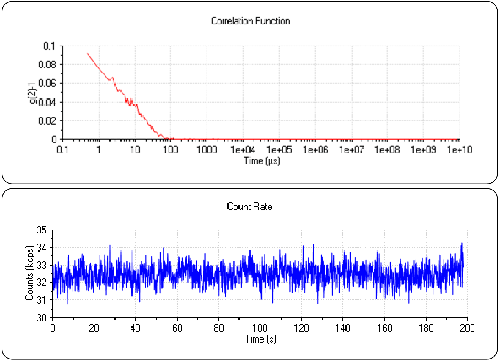
Figure 3 shows the count rate and correlogram for the Lysozyme sample. The count rate is now 32.5kcps. Again, it is very stable for the duration of the sub-run with no systemic variations or drift. This indicates a very stable measurement, excellent temperature control and also that the sample is very clean. The correlation function now clearly shows the signal from the protein and has an intercept of approximately 0.1. The low intercept is a consequence of the low concentration of the sample but it is clearly a signal that is not present in the water sample (figure 2).
|
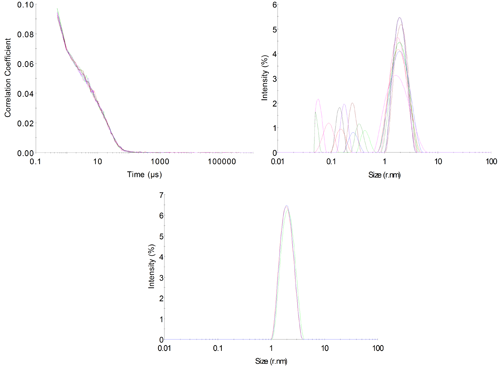
A series of measurements should always be performed to assess the quality of the data. This is especially important when operating at the sensitivity limits of an instrument to ensure that the recorded data is repeatable and not an artifact from the system itself. In this case, 10 repeat measurements were made in order to assess the variability of the results. Of these, 9 passed the DTS software's own quality checks of measurement and data quality. The correlation functions for these measurements are shown in figure 4A.
|
The correlograms overlay nicely but a certain amount of noise is visible within them. The 'protein analysis' distribution algorithm was used to derive size distributions from the correlograms (figure 4B). It can be seen that the primary peak in the distribution overlays with good repeatability with a hydrodynamic radius of 2.02±0.07nm, which is appropriate for this protein.
A secondary peak with a more variable size of 0.22±0.12nm is also visible. This is quite common in measurements at low concentrations, with low levels of excess scattering and is often described as a 'solvent peak'. However, the variability of the size suggests that this is an artifact in the scattering data.
Displayed data could be modified to exclude this artifact peak to make the data more pleasing, (figure 4C) but when making measurements at the limit of sensitivity this does not seem appropriate as more variation within the results must be accepted and the unmodified data can give a better visual assessment of the quality of the result
Measurements made at the sensitivity limits of DLS instruments are challenging but good experimental practice and careful sample preparation coupled with appropriate scientific analysis enables measurements of samples such as Lysozyme to be made at low concentrations and in low volumes.
The Zetasizer μV has excellent sensitivity and with its 90º measurement angle can achieve this sensitivity even in sample volumes as low as 2μl.