Novozymes Biopharma UK
This case study demonstrates the resolving and detection capabilities of size exclusion chromatography light scattering (SEC-LS) and dynamic light scattering (DLS). To mimic the appearance of small oligomers, mixtures of two different proteins were used. A 65kDa human serum albumin (Albucult, Novozymes Biopharma UK) sample was used for the monomer protein. This protein shows very good stability in its formulation buffer and is therefore a very useful DLS reference sample [1, 2]. Alcohol dehydrogenase (ADH) was used as it is similar in molecular weight to a dimer of Abucult, as ADH has a molecular weight of about 150kDa.
Stock solutions of both proteins were prepared in PBS buffer and filtered through a 0.02µm Whatman Anotop10 filter to ensure that no aggregates or dust particles were present in either sample. The Albucult sample was spiked with increasing amounts of ADH. The level of ADH is given in % of ADH (in terms of moles of ADH compared to total moles of protein in the sample). The samples were first measured by DLS on a Zetasizer Nano ZS and then duplicate measurements of 100µl of each sample were injected for analysis by SEC-LS on a Viscotek TDAmax.
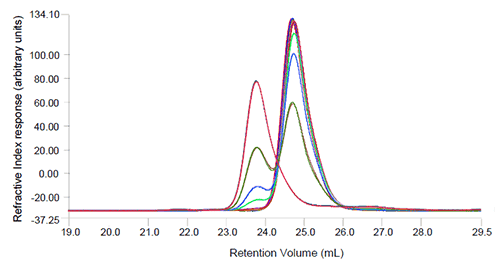
The SEC-LS measurements show partial separation of the Albucult and ADH peaks as shown in the
chromatograms (Figure 1) where the refractive index detector signal is shown. In a SEC experiment it would be expected that the larger protein, in this case ADH should elute first and the smaller protein, here Albucult, should elute later (at higher elution volumes). The light scattering detector was sensitive enough to detect the presence of ADH even in the 1.5% ADH sample. Neither the UV nor the RI detectors were sensitive enough to allow accurate determination of the molecular weights at this low concentration. The light scattering and RI traces were used to determine the molecular weight for samples with a level of ADH above 7.7% and, as seen in Table 1, the values determined for Albucult and ADH are close to the known molecular weight values. The determined Albucult molecular weights, as shown in Table 1, are showing an upward trend in mass due to the limited resolution of the two proteins on the column. The left edge of the Albucult peak contains an increasing proportion of higher molecular weight material as the amount of ADH increases and therefore the measured molecular weight will increase. This could be improved by using a column with higher resolving power or using multiple columns.
|
% ADH in Stock Solution | Measured % ADH | Albumin Mw (kDa) | ADH Mw (kDa) | |||
|---|---|---|---|---|---|---|
Run 1 | Run 2 | Run 1 | Run 2 | Run 1 | Run 2 | |
0.00 | 0 | 0 | 67 | 67 | N/A | N/A |
0.15 | 0 | 0 | 67 | 67 | N/A | N/A |
0.76 | 0 | 0 | 66.8 | 66.8 | N/A | N/A |
1.51 | 0 | 0 | 66.5 | 67.1 | N/A | N/A |
7.72 | 4.1 | 4.1 | 69.3 | 69.5 | 152 | 151.7 |
15.85 | 10.4 | 10.5 | 73 | 71.8 | 149.5 | 151.5 |
42.97 | 32.3 | 32.1 | 76.3 | 75.8 | 146.7 | 145.5 |
100 | 100 | 100 | N/A | N/A | 147.7 | 148 |
In contrast to SEC-LS measurements, DLS in batch mode is not able to resolve these two proteins, as the resolution in DLS requires a minimum threefold difference in population sizes. In the case of these proteins, this would be equivalent to a molecule of RH ~10.8 nm (where Albucult RH =3.6 nm) which would correspond to a globular protein complex with a molecular weight of around 880kDa which is far larger than the 150 kDa ADH.
However, DLS is extremely sensitive to changes in the sample, and although it will not give two distinct peaks, the peak will change in its mean size and its width, allowing comparisons between samples and identification of samples where substantial dimerization, oligomerization or aggregation is occurring. This comparison can be used to monitor the same sample over time, for example, or the difference between samples as in this case study.
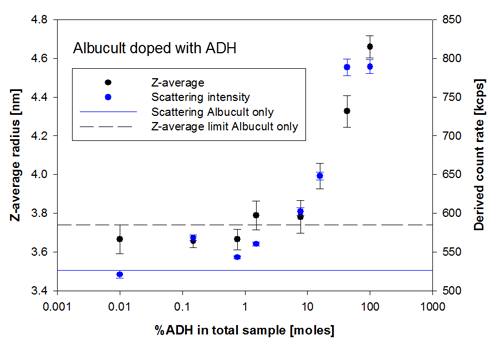
In Figure 2, the change in scattering intensity (derived count rate) and the intensity weighted mean radius (Z-average) are plotted as a function of the %ADH in the total sample. It is clear that, just as in the SEC-LS measurements, there is a substantial change detected at 7.7% ADH and above, but the mean size of the sample (z-average) is already increasing at 1.5% of ADH, indicating the presence of oligomers.
|
As seen in this case study, the light scattering signal detects the ADH at very low levels both in SEC-LS and DLS measurements. The limiting factor determining the molecular weight in the SEC-LS measurements is the concentration signal and the resolving power of the SEC column used. When the peak concentration is sufficient for determining the molecular weight, SEC-LS is an excellent tool for characterizing the type of oligomers or aggregates present in a stable form in the sample.
In comparison, DLS provides a rapid measurement that allows the comparison of a number of sample conditions within a short time and gives a clear indication not only of the presence of large aggregates but also of the presence of small oligomers or aggregates present in the sample.
[1] "Investigating the stability of recombinant human serum albumin under a range of pH conditions with both time and temperature"
Poster presentation by Mr Karl Nicholls, Novozymes Biopharma UK, May 2010, at BPI Europe 2010, Vienna - Austria
[2] MRK1614 High concentration application note