Zetasizer Nano is the market leader in dynamic and electrophoretic light scattering technology for measurements of hydrodynamic size and electrophoretic mobility. Dynamic Light Scattering (DLS) is a widely implemented technique for characterization of proteins and their formulations; allowing not only the determination of molecular size but also an assessment of stability. In recent years, the stability of proteins in solution has attracted significant scientific and commercial interest, due to the exponential growth in the use of proteins as biotherapeutic drugs. Since knowledge of formulation stability and behaviour are paramount for delivery of a safe and commercially viable product, the demand for tools that can characterize these formulation properties has increased. Protein mobility - measured using electrophoretic light scattering (ELS) - is one property that has been identified as a promising indicator of formulation stability, viscosity and behaviour [1].
Experimentally, protein mobility measurements present two practical challenges. (i) Working with protein solutions often means working with dilute concentrations. In DLS terms, this means working with a small amount of small-sized molecules that scatter proportionately low levels of light. Until now, most light scattering based instruments available on the market lack the sensitivity required for such measurements. (ii) Acquiring protein mobility measurements requires the application of an electric field to the sample - a physical process that itself can cause damage to the protein by stimulating aggregation [2]. Consequently, the resultant mobility measurements reflect that of the aggregate molecules rather than the protein of interest.
Accurate and high quality measurements of protein mobility have three key requirements:
|
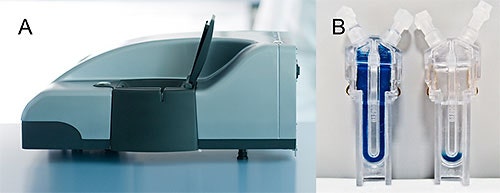
The Zetasizer Nano ZSP (ZSP, Figure 1A) and associated software have been specifically developed to satisfy these requirements. With working concentration limits as low as 1 mg/mL for Lysozyme, the light scattering sensitivity of the optics in mobility measurements allows for analysis of both small-sized particles and low concentration samples. Furthermore, the phase analysis light scattering (PALS) used by the ZSP enhances measurement of low mobility samples, such as proteins.
Work by scientists at Malvern Instruments has shown that much of the aggregation that occurs during electrophorectic measurements takes place at the electrodes [3]. The use of the Diffusion Barrier Method (Figure 1B), a technique invented and patented by Malvern Instruments, protects the protein sample by isolating it from the cell electrodes [2, 4]. This means that the applied voltage can be applied for a longer period to generate more reliable data from the measurement [3]. The Diffusion Barrier Method is referenced in the latest ASTM standard on the measurement of mobility of nanosized biological materials [2].
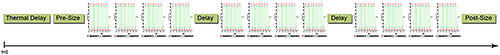
The Zetasizer software for the Zetasizer Nano ZSP also includes a dedicated protein mobility measurement protocol. This measurement protects the sample from aggregation by reducing the voltage and carefully controlling the in-cell temperature to ensure that aggregation does not take place. Before and after the mobility measurements, the system also performs a size measurement using exactly the same optics (Figure 2). The measured size distribution therefore directly represents the population whose mobility is being measured. This is an advantage because if the size is measured through different optics to the mobility, the light scattering intensity can change and may mask the aggregates that form. By making size measurements through the same optics before and after the mobility measurement, the Zetasizer Nano ZSP identifies any aggregation that may have occurred during the measurement.
|
Finally, accurate measurements of protein electrophoretic mobility allow the charge of the protein to be calculated based on known relationships between protein mobility and charge [5]. The new calculator suite in the Zetasizer software can be used to make these calculations.
This application note describes the measurement of protein mobility using the ZSP. With the sensitivity of the ZSP, the good practise of the diffusion barrier method and appropriate measurement protocols, the most accurate readings possible are obtained.
Human Serum Albumin (HSA) was prepared in different buffers to a final concentration of approximately 2 mg/mL. The buffers were its original formulation buffer at pH 7 and a citrate buffer at pH 4.3. The samples were filtered through a 0.02 µm filter to ensure no aggregates were present at the start of the measurement.
The diffusion barrier method was used to protect the sample from aggregation by coming into contact with the cell electrodes. A disposable folded capillary cell was filled with the appropriate buffer. 20 µL of the diluted HSA was loaded into the optical area at the bottom of the cell using a gel loading pipette tip. The cell was inserted in the instrument and the size and zeta potential measurements were performed.
The hydrodynamic size and mobility of HSA were respectively measured by DLS and ELS using the Zetasizer Nano ZSP. Size and mobility were both measured at the same scattering angle to confirm that the measured zeta potential corresponded to the protein and not any aggregated material.
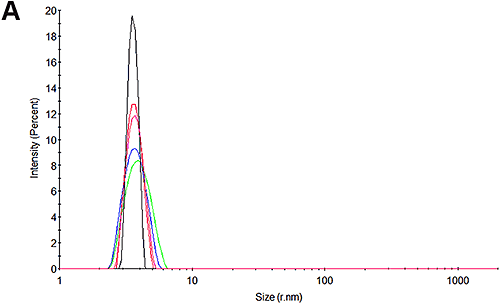
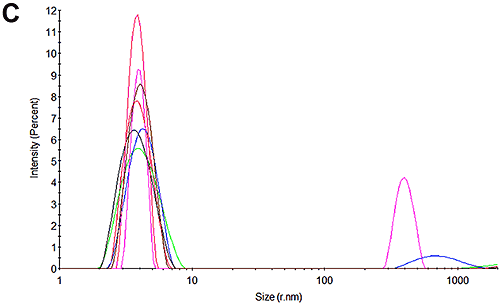
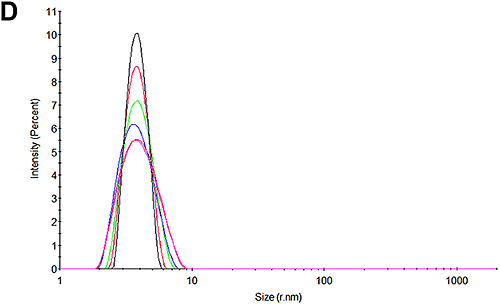
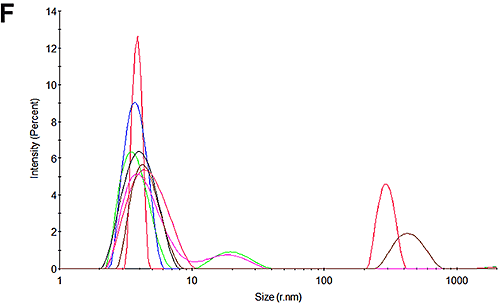
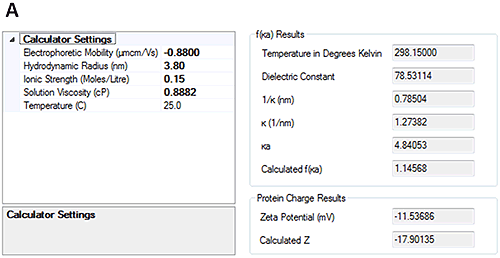
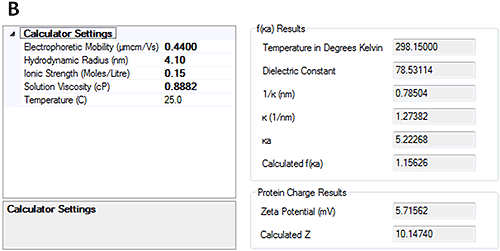
Figures 3A and 3D show the size distributions measured for the pH 7 and pH 4.3 samples at the beginning of the experiment respectively. In line with expectations, it may be seen that there is only one peak in the distributions. At pH 7, the size is 3.8 nm which is in good agreement with that reported for HSA. Interestingly, at pH 4.3, the size is slightly larger at 4.1 nm. Whether this is a structural change or an indication of a higher level of oligomerization or an early indication of some aggregation cannot be determined with this technique.
|
|
|
|
|
|
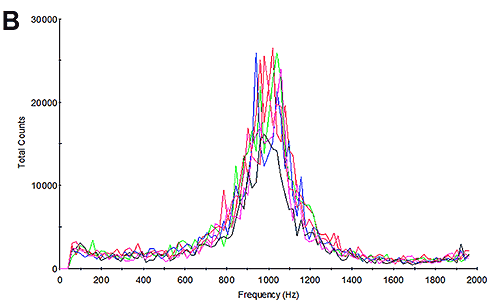
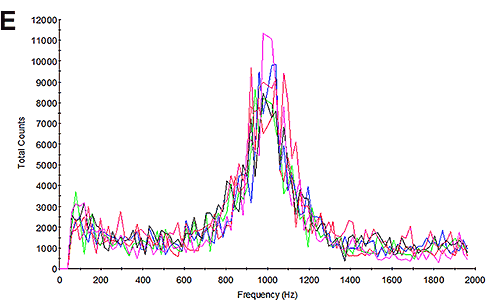
The mobility measurements of the samples were then undertaken and the results calculated. Figure 3B and 3E show the frequency plots from the mobility measurements. Studying the frequency plot is an excellent way of assessing the measurement quality [6]. With their small size, proteins diffuse as high speed. During an electrophoretic measurement, they will be undergoing electrophoresis; however the high diffusion rates are not completely overcome by the electrophoresis. As a consequence, the shift in frequency of the scattered light is a broad peak because it contains a significant diffusion component. Since aggregates are larger, the frequency plot from a sample containing aggregates will have a much smaller diffusion component and therefore a much larger and sharper peak. This is explained in greater detail in application note MRK1651; and in reference [4]. The frequency plots here have broad shallow peaks indicating that the measurement is primarily of the protein and not of aggregates.
The measured electrophoretic mobility for HSA at pH 7 is -0.88±0.2 µmcm/Vs and at pH 4.3 is 0.44±0.2 µmcm/Vs. These results demonstrate that the sample is crossing its isoelectric point between the two pH points.
Having measured the electrophoretic mobility, the new calculators in the Zetasizer software allow the overall charge of the protein to be calculated from the measured hydrodynamic size and electrophoretic mobility. Figure 4 shows that at pH 7, the calculated charge of HSA was approximately -18 whereas at pH 4.3 the calculated charge was approximately +10.
|
|
Figures 3C and 3F show the size distributions of the samples after the mobility measurements have been made. The results show that only a very small amount of aggregation occurred during the measurements. In both cases the primary peak is the dominant peak in the distribution accounting for 99% of the scattered light at pH 7 and 90% of the sample at pH 4.3. The results from these mobility measurements therefore have very high confidence. The pH 4.3 sample was shown to be aggregating over time in the absence of the electric field and this is most likely due to the low pH. This effect also accounts for the small amount of aggregation that occurs during the measurement.
Overall, the results give a measured mobility that is in line with previously published values. Furthermore, the measured protein mobility can be seen to become more positive at lower pH values, which is exactly as expected. The repeatability and quality of the measurements is excellent giving high confidence in the accuracy of the results. This can be seen in the broad frequency plots and the minimal level of aggregation in the subsequent DLS measurements.
The calculated protein charges were compared against the work done by Tanford [2]. At pH 7, Tanford showed that HSA has a valence of approximately -16 so the measurements are in good agreement with those presented here. At pH 4.3 Tanford showed that HSA had a valence of approximately +20. This is more positive than the data presented here. There are a number of possible reasons for this including the buffer used in the experiments and the sources of the HSA but the overall agreement of the techniques is demonstrated in reference [6].
The Zetasizer Nano ZSP and the associated software, along with the Diffusion Barrier Method all ensure that high quality measurements are made in a reliable a practical measurement process. This is achieved in three different ways:
In conclusion, the mobility of HSA was successfully measured in different buffers at a concentration of just 2 mg/mL. Since the Diffusion Barrier Method requires only a small amount of sample protein, these measurements can also be achieved at only the minimum expense of sample, in this case, just 20 µL.