Viscosizer TD provides automated relative viscosity measurements with high reproducibility at low viscosity, to help identify molecules with abnormally high viscosity-concentration profiles at low sample concentrations as early as possible in the development pipeline.
The use of therapeutic antibodies is one of the fastest growing sectors for novel biopharmaceuticals, and the industry is under increasing pressure to deliver new therapies in a timely and safe manner. Biopharmaceutical development processes are lengthy and complex with very specific analytical challenges, and particularly severely limited sample availability at the start of the pipeline. Against this constraint, the ability to assess biophysical parameters as key quality attributes as early as possible in candidate validation/early formulation development stages can reduce costs and save time, and minimize risk from prompt identification of potential problem candidates.
High viscosity issues are problematic both during bioprocessing and patient administration. The ability to screen early stage candidates and formulations for abnormal viscosity changes, using measurements at low concentrations and very low sample volumes, can help identify monoclonal antibodies (mAbs) with potential developability issues. Degradation of mAbs most commonly occurs through self-association1, and aggregation can cause changes to the viscosity of formulations2.
By setting target viscosity-concentration profiles, and using an automated relative viscosity screen with high resolution and high reproducibility at low protein concentrations, mAbs with abnormally high viscosity increases can be identified using only a small amount of sample. Lavoisier and Schlaeppi3 reported that mAbs showing abnormally high viscosity profiles with concentration could be sorted from those with low viscosities at concentration as low as 25mg/mL.
Malvern Viscosizer TD is an automated biophysical characterization tool utilizing Taylor Dispersion Analysis and providing ultra-low volume, solution-based molecular size and stability measurement capabilities, combined with microcapillary Poiseuille flow for relative viscosity assessment.
Relative viscosity measurements are performed by injecting a sample plug of 6µl (typically) into the capillary under constant drive pressure. The sample plug edges are detected at two fixed windows along the capillary, simply by Refractive Index change, and the time between windows is measured (Δts). The sample time is then referenced against the time taken for a solvent or buffer of known viscosity (e.g. water) to travel between the windows (Δtr) to enable the viscosity of the sample to be calculated. Automatic procedures are used to clean the microcapillary and repeat measurements. Samples are held in a temperature-controlled autosampler prior to measurement.
The following work details measurements of a mAb in various formulation buffers, and with the addition of common excipients, to show the small variations in viscosity with concentration and excipient changes that the microcapillary flow technique is able to reliably measure.
Buffer | Measured pH |
|---|---|
Citrate | 4.035 |
Histidine | 7.763 |
Phosphate | 7.225 |
Table 1 pH measurements of buffer solutions
mAbs Concentration (mg/mL) | Excipient Added |
|---|---|
13.5 | None |
5 | None |
1 | None |
1 | 0.5 M sucrose |
1 | 0.05% Tween 20 |
Table 2 Sample concentrations for each buffer plus additional excipients
Figures 1-3 are radar charts for the three buffers (citrate, histidine and phosphate) showing the change in viscosity for different concentration mAb solutions, and at 1mg/mL with the addition of two excipients (as detailed in Table 2), at the three measurement temperatures.
These plots clearly show the expected change in viscosity with temperature, with the viscosity of each sample increasing as the temperature decreases.
Figures 4 is a bar chart showing the differences in mean viscosity for mAbs samples at the three different concentrations in each buffer at 25°C.
Figure 5 is a bar chart showing the differences in mean viscosity for mAbs samples at 1mg/mL concentration in each buffer and with the addition of sucrose and Tween 20 as excipients, at 25°C.
The error bars on each of these charts show the relative standard deviation of the measurements for each sample (from 5 replicates), and demonstrates the ability of the microcapillary flow technique used in Viscosizer TD to produce high resolution and highly reproducible data for relative viscosity measurements at low viscosities.
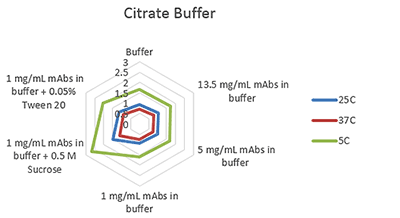
Figure 1 Radar chart of citrate buffer sample viscosity results measured at each run temperature (viscosity units are cP (or mPas))

Figure 2 Radar chart of histidine buffer sample viscosity results measured at each run temperature (viscosity units are cP (or mPas))

Figure 3 Radar chart of phosphate buffer sample viscosity results measured at each run temperature (viscosity units are cP (or mPas))
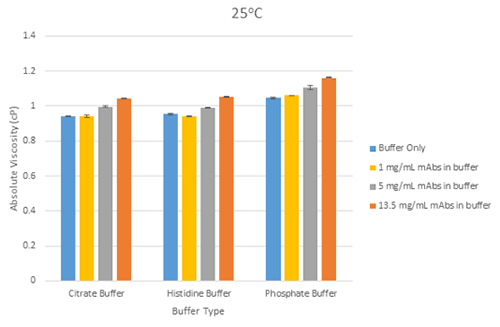
Figure 4 Bar chart showing showing the differences in mean viscosity for mAbs samples at three different concentrations, grouped by their buffer, at a measurement temperature of 25°C (error bars show the relative standard deviation of the measured viscosities)
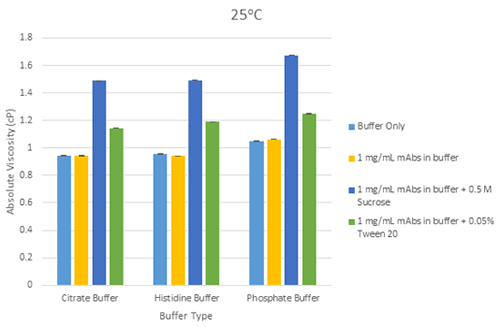
Figure 5 Bar chart showing the differences in mean viscosity for mAbs samples at 1mg/mL concentration, grouped by their buffer and with the addition of sucrose and Tween 20 as excipients, at a measurement temperature of 25°C (error bars show the relative standard deviation of the measured viscosities)
Figure 6 shows data at 25°C for citrate and phosphate buffers plotted against mAb concentration, and the expected linear increase in viscosity at low concentrations i.e. the protein molecules are isolated entities in solution at these concentrations. As mAb concentration increases to high concentrations, the protein molecules in solution will start to interfere with each other and become entangled, causing an exponential increase in viscosity (and non-Newtonian behavior).
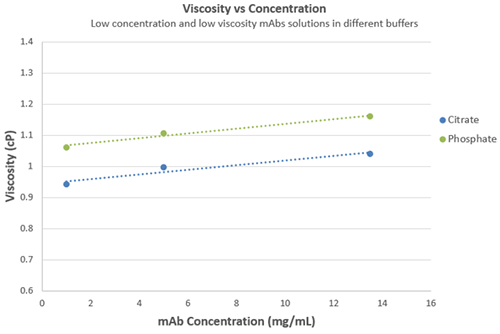
Figure 6 Plot of viscosity against concentration for mAb solution in citrate and phosphate buffers at 25°C
The increase is viscosity for 1mg/mL mAb solutions containing excipients (sucrose and Tween 20) is mainly due to the additive viscosity in the solution from the excipient. The same relative viscosity screening principle can be followed for formulations containing excipients to enable abnormally high viscosity responses to be identified, which typically arise from conformational change and/or self-association of the protein molecule in the solution conditions under evaluation.
The relative viscosity methodology used in the Viscosizer TD has demonstrated its ability to discern small differences between low viscosity protein formulations and give very repeatable results.
These differences include the effect concentration of sample in various buffers, the addition of excipients and the effect temperature can have on the viscosity.
These attributes are particularly well suited to early developability stages of the biopharmaceutical pipeline, given the added benefits of automation and ultra-low sample volume requirements.
By setting appropriate working limits on viscosity-concentration profiles for mAbs systems, relative viscosity screening using a high resolution technique with high reproducibility is able to highlight deviations from acceptable viscosity behavior at low concentrations, to identify potential problem candidates as early as possible in the development pipeline.