When producing particles of a known size, the monodispersity of the samples in terms of both size and shape is important and often requires a high-resolution technique such as TEM to look at these sample properties. For example, Particle Works, a brand of Blacktrace Holdings Ltd, produce gold nanoparticles which must be highly monodisperse and have high batch-to-batch consistency, with CV values as low as 5% for the size distribution and 2.5% for the batch consistency. Currently, Particle Works use TEM as the primary technique for characterizing their samples for QC. However, TEM is a time consuming and expensive technique that requires an experienced user to perform analysis. In this study we show how the Zetasizer Ultra can be used to identify the majority of 'out of specification' batches of gold nanoparticles and therefore significantly reduce the amount of TEM analysis required.
When producing particles of a known size, the monodispersity of the samples in terms of both size and shape is important and often requires a high-resolution technique such as Transmission Electron Microscopy (TEM) to look at these sample properties. For example, Particle Works, a brand of Blacktrace Holdings Ltd, produce gold nanoparticles which must be highly monodisperse and have high batch-to-batch consistency, with CV values as low as 5% for the size distribution and 2.5% for the batch consistency. Currently, Particle Works use TEM as the primary technique for characterizing their samples for QC. However, TEM is a time consuming and expensive technique that requires an experienced user to perform analysis. Particle Works were therefore keen to explore whether the Zetasizer Ultra could be used to reduce the amount of TEM analysis required.
The Zetasizer Ultra has multiple features that help to reduce the time taken for measurements to be carried out while providing much more detail on sample properties. These include Adaptive Correlation, Multi-Angle Dynamic Light Scattering (MADLS) and Depolarized Dynamic Light Scattering (DDLS).
In this study, samples of Particle Works gold nanoparticles were measured using both TEM and Multi-Angle Dynamic Light Scattering (MADLS)with the Zetasizer Ultra to determine whether the samples were of high enough quality to be sold.
The samples tested in this study were gold nanoparticle samples synthesized by Particle Works during the early development of the Ultraspherical Gold Nanoparticle product range. Target sizes of 10, 15, 20 and 50 nm were measured on the Zetasizer Ultra using MADLS in DTS0012 plastic cuvettes. These samples were also measured using TEM with at least 100 particles being measured for each sample. Details of the samples measured are shown in Table 1, including their target size.
| SAMPLE NAME | TARGET SIZE (nm) |
| Au-2-016-7 | 10 |
| Au-2-016-13 | 15 |
| Au-2-17-6 | 20 |
| Au-2-037-4 | 50 |
| Au-2-041-3 | 50 |
Table 1: Sample details including target size
For all of the samples, the Peak by Intensity values as measured by the Zetasizer are higher than those measured by TEM due to the effects of stabilising ligands, ionic surfactants and hydration layers, which increase the hydrodynamic size of the dispersed gold. Zetasizer measures the hydrodynamic diameter of the gold, while TEM only measures the core particle diameter, therefore this is the primary reason for the discrepancy.
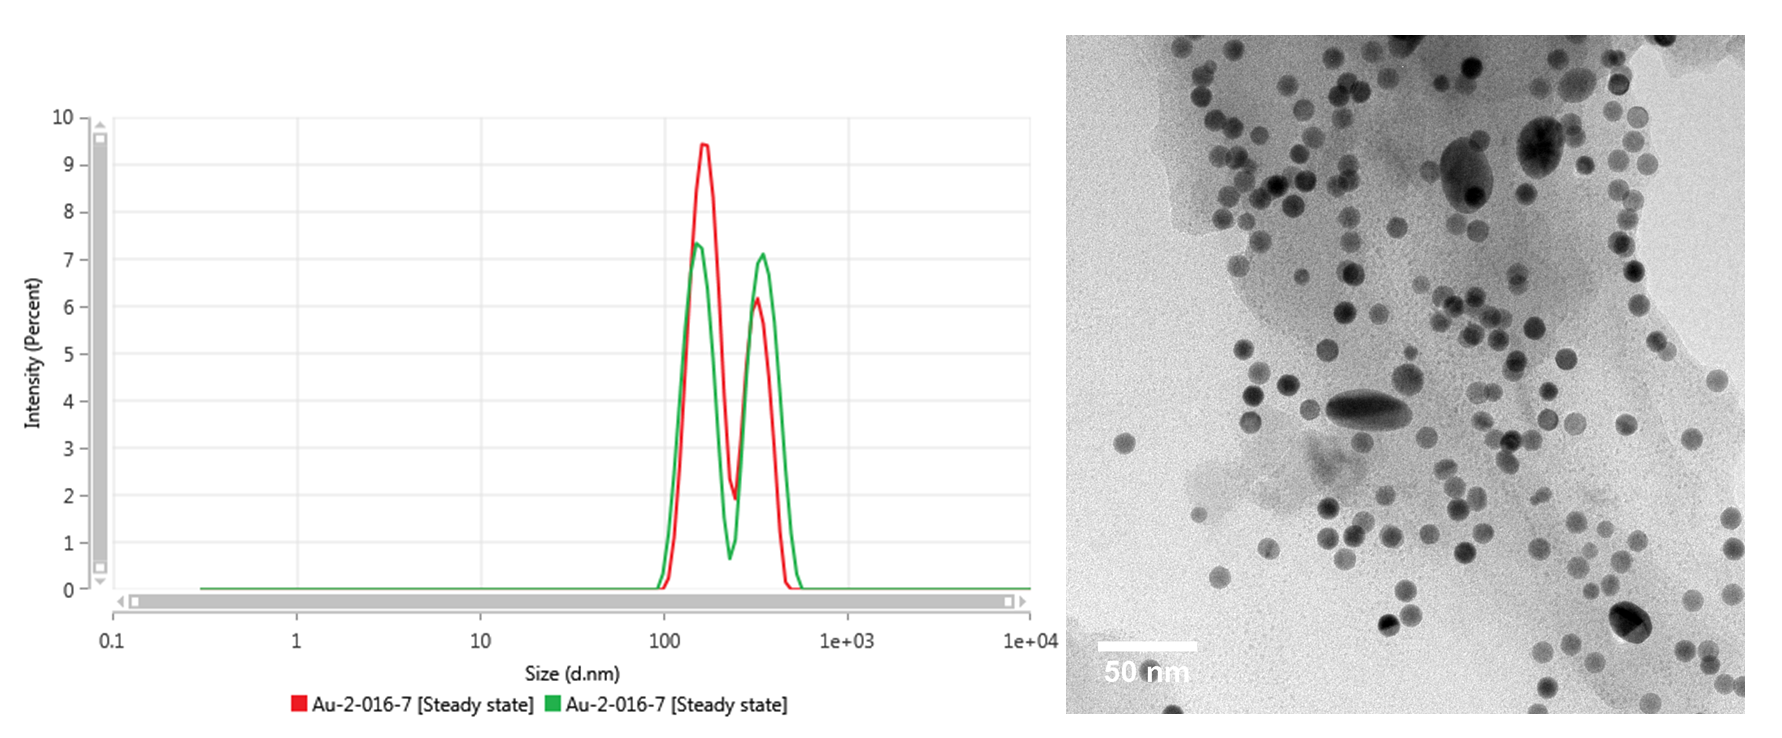
Measuring the first sample, Au-2-016-7, with DLS showed the size populations to be much larger than the target size of 10 nm, to the point that the 10 nm peak does not appear in the distribution shown in Figure 1. Therefore, this sample has failed to meet the specifications. The TEM image also shows that there are multiple large particles but also shows the expected 10 nm particles. It is likely that these are being masked in the MADLS measurement by the scattering of the larger particles.

Figure 1: Intensity size distribution (left) as measured by MADLS and TEM (right) of Au-2-016-7
Measuring the second sample, Au-2-017-6, with MADLS would suggest that this sample is on specification as a narrow distribution is measured (Figure 2). However, the TEM measurements disagree, as while the majority of the populations fall within the expected range, there is a tail of particles below the target size which means it does not meet specifications. The MADLS measurements was unable to pick this up because the scattering of the sample is much more skewed towards the larger sizes masking that of the tail of smaller particles. This means that while the MADLS measurements are well suited to detecting particles that are larger than the majority of the sample, they are less able to identify a sample that contains particles which fall under the specification.

Figure 2: Intensity size distribution as measured by MADLS (left), TEM image (centre) and the TEM size distribution (right) of Au-2-017-6
For the third sample, the TEM image, as shown in Figure 3 shows a uniform size distribution that falls within specifications for the particles themselves. However, there are rings around many of the particles and it is unclear if these are a true reflection of the particle size when dispersed or if this is a result of the drying process. By measuring the sample using MADLS, it can be seen the distribution is narrow and within specifications. If the rings were around the particles when dispersed then the DLS distribution would be much wider and higher in size. Therefore, it is likely during the drying process some of the surfactant in the dispersion has dried around the particles causing these visible rings. By identifying that these rings are not representative of the sample means that this sample can be sold.

Figure 3: Intensity size distribution as measured by MADLS (left), TEM image (centre) and the TEM size distribution (right) of Au-2-037-4
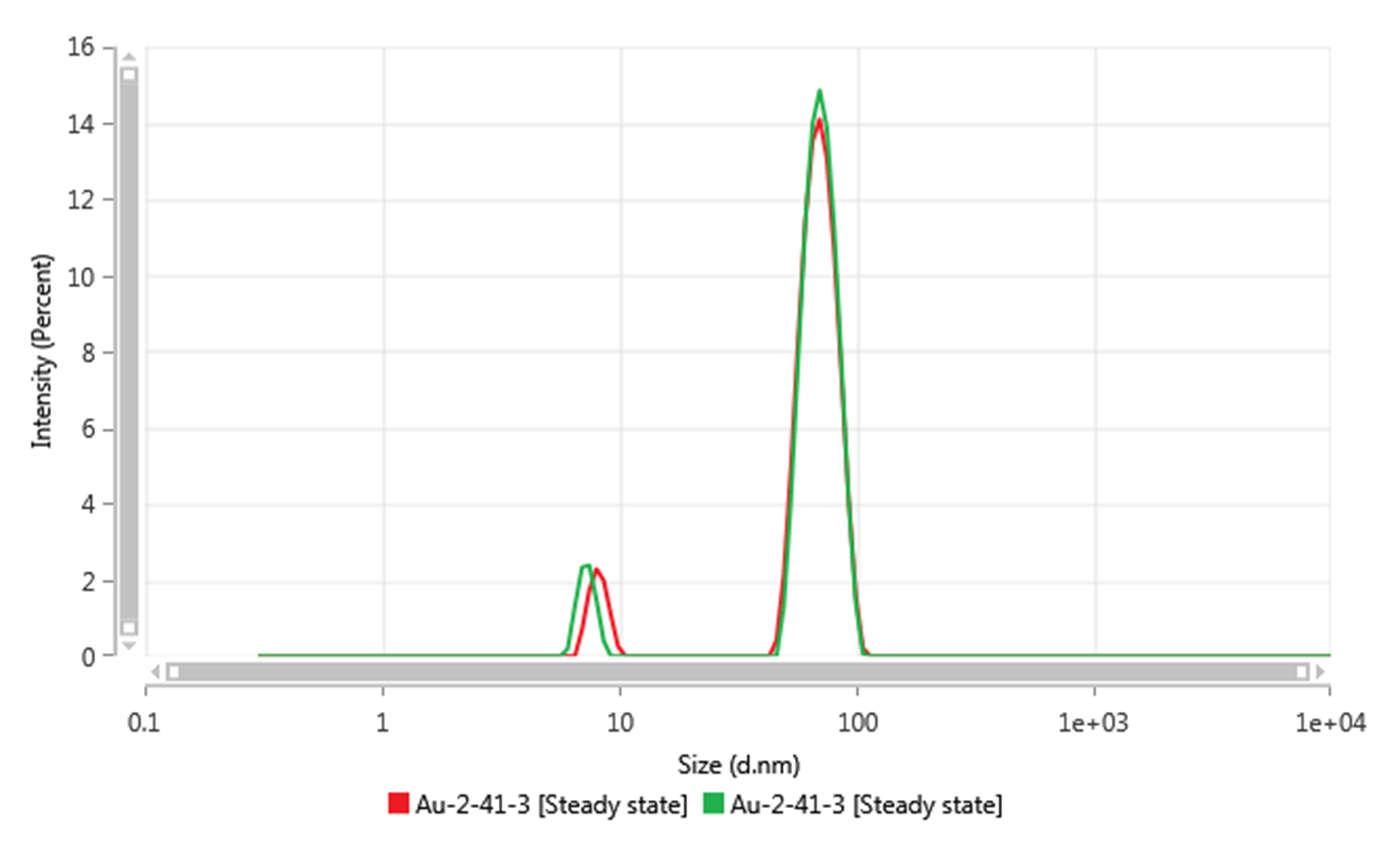
The fourth sample, Au-2-041-3, was measured using MADLS, shown in Figure 4, and while the distribution was mostly uniform, there was an unexpected small peak below 10 nm.

Figure 4: Intensity size distribution as measured by MADLS of Au-2-041-3
With an unexpected peak such as this it can be useful to use the DDLS capabilities on the Zetasizer Ultra. By removing the vertically-polarized scattered light, leaving just the horizontal-polarized scattered light, it can be determined whether this unexpected peak is due to translational diffusion of particles and therefore another population present in the sample. Alternatively, this peak could be due to the rotational diffusion of a non-spherical particle, if so, then the <10 nm peak would be expected to increase in relative intensity compared to the larger size peak when using horizontal polarisation.
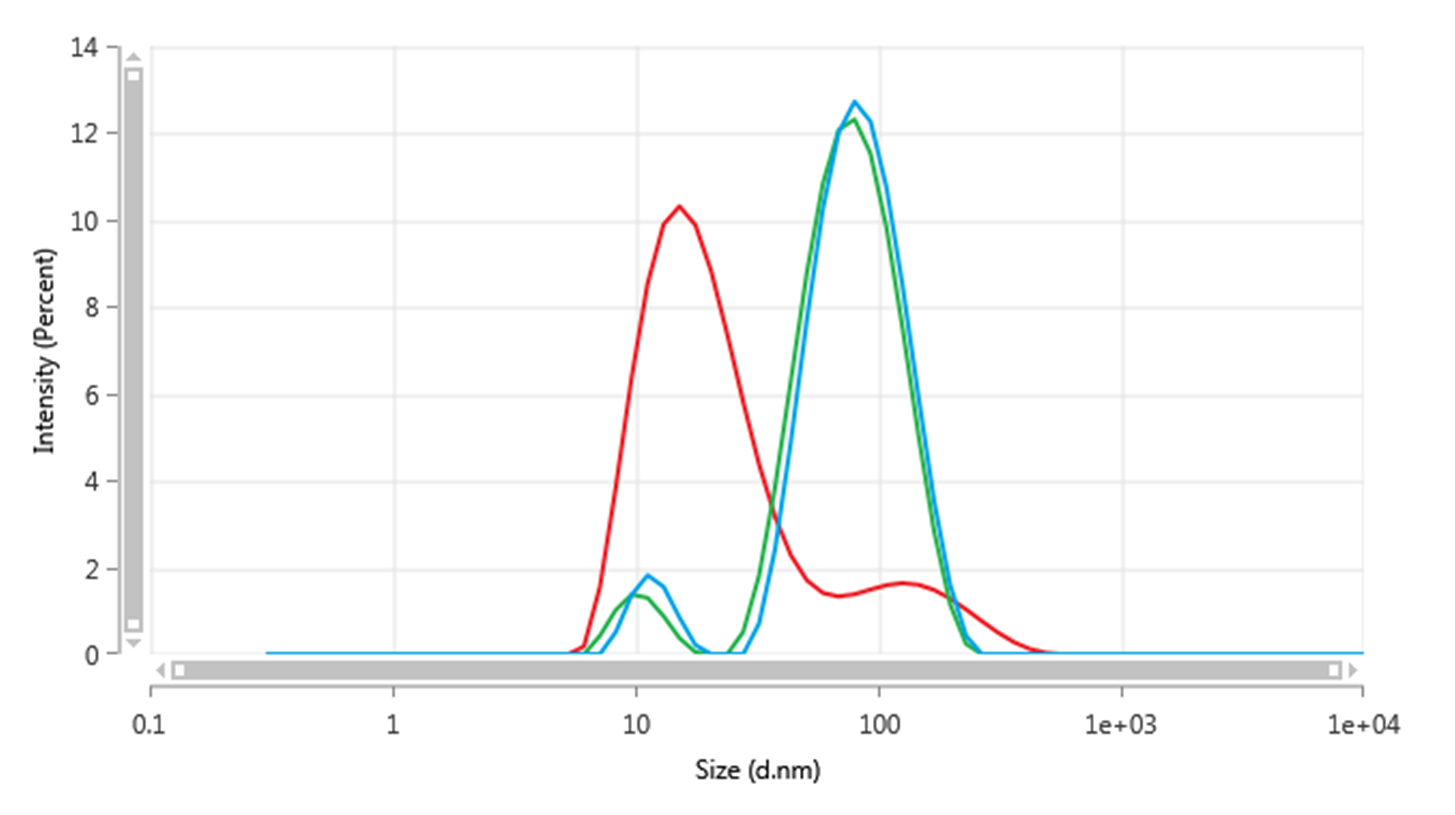
Measurements using both polarizations (a typical backscatter measurement), vertically-polarized light and horizontally-polarized light were made as shown below in Figure 5. As can be seen while the vertically-polarized backscatter measurement is similar to the typical measurement, the horizontally-polarized measurement has a much higher relative intensity for the smaller size peak than the higher size peak. This means that the small size peak is not due to the translational diffusion of particle but instead the rotational, therefore, some of the particles are not spherical.

Figure 5: Intensity size distributions of Au-2-041-3 in backscatter using all polarizations (blue), vertical polarization (green) and horizontal polarization (red)
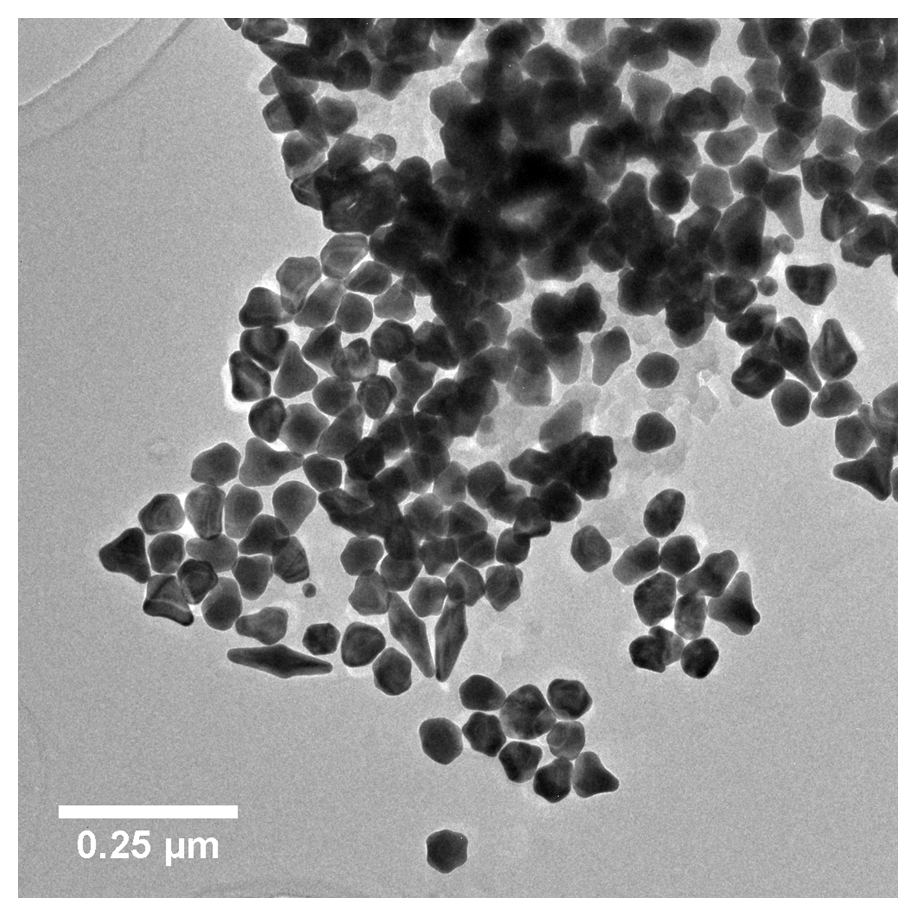
The sample was also measured on TEM, shown below in Figure 6, which confirms the conclusion from using MADLS. This shows that many of the particles are faceted rather than spherical and some are even rod like. These rod-like particles are most likely those that cause the <10 nm peak seen when using DLS.

Figure 6: TEM image of Au-2-041-3
The results from measuring the final sample with MADLS show it to be a sample with monomodal, narrow distribution, shown in Figure 7. This suggests this sample meets the specification which is confirmed by the TEM measurements which also show the sample contains a uniform size. These data confirm that this sample is a production quality sample suitable for sale to customers.

Figure 7: Intensity size distribution as measured by MADLS (left), TEM image (centre) and the TEM size distribution (right) of Au-2-016-13
The Zetasizer Ultra has been shown to be a useful tool for QC for both R&D and manufacturing. Its speed and ease of use means that multiple samples can be quickly measured to decide on if they are within specifications. In this study, the use of the Zetasizer has meant that fewer samples need to be measured using TEM as many off spec samples have been identified using the Zetasizer Ultra alone.