In this report X-ray fluorescence and FP Multi are used to determine thickness and stoichiometry of TiNx thin films.
X-ray fluorescence spectrometry provides a non-destructive, highly reproducible and robust method of analyzing thin films on wafers. These attributes make XRF analysis a highly cost-effective method for the analysis of a large variety of films used in the semiconductor manufacturing process.
Titanium nitride (TiNx) layers have been found very useful in the manufacture of integrated circuits. TiNx acts as an excellent barrier material against dopant diffusion between semiconductor layers and also been forms a good ohmic contact with other conductive layers. Determination of thickness and stoichiometric ratio (x) of TiNx layers is important because these parameters determine the electrical and microstructural properties of the layer. The typical thickness of TiNx layers used in semiconductor manufacturing is roughly 50 to 1000 Å with the stoichiometric value x varying from 1.0-1.2.
X-ray fluorescence spectrometry provides a non-destructive, highly reproducible and robust method of analyzing thin films on wafers. These attributes make XRF analysis a highly cost-effective method for the analysis of a large variety of films used in the semiconductor manufacturing process.
The 2830 ZT XRF Wafer Analyzer combined with FP Multi offers an excellent solution for simultaneous analysis of thickness and composition of single layers and stacks. FP Multi uses Fundamental Parameter analysis of thin films and stacks which minimizes the required amount of calibration samples and offers flexibility in selecting calibration materials. This constitutes a great advantage for thin film analysis as in-type calibration standards are often not readily available.
In this report X-ray fluorescence and FP Multi are used to determine thickness and stoichiometry of TiNx thin films.
The Malvern Panalytical 2830 ZT Wafer Analyzer used in the analysis of the TiNx samples was equipped with a 4 kW SST-maX50 X-ray tube and fixed channels for titanium and nitrogen.
Details of the measurement conditions are presented in Table 1.
Table 1. Measurement conditions

Calibration and analysis
FP Multi was used for calibration and analysis of the TiNx thin film samples. In the calibration process, FP Multi models the X-ray generation process, taking into account the layer sequence, density, thickness, and composition of the calibration standards. In this way theoretical intensities are derived from the stack description of the sample for the characteristic X-ray lines of interest. The theoretical intensities obtained from the X ray characteristic lines are then related to the actual measured intensities, yielding the instrument factor, which is defined by the slope and intercept of the calibration line.
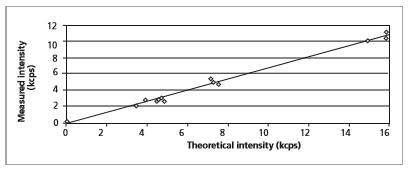
For the analysis of unknown samples the calculated intensities are matched to the measured intensity through an iterative process in which the thickness and composition of the film is varied, and the instrument factor is taken into account. Twelve calibration samples were used with thickness ranging from 0 to 200 Å and stoichimetry values between 0 and 1. The calibration samples were referenced using X-ray reflectometry. Using the reference values acquired by XRR, linearly correlated calibration lines were obtained, shown in Figures 1 and 2.
Measurement protocol
A dynamic reproducibility test was performed by consequently measuring the center spot of a wafer with a TiNx film, incorporating unload and reload after each measurement. Thirty measurement cycles were performed and a measurement time of 100 s was used. In addition, a 41-spot wafer pattern analysis was performed to verify the homogeneity of thickness and composition throughout the whole wafer.
Figure 1. Calibration line for N Kα
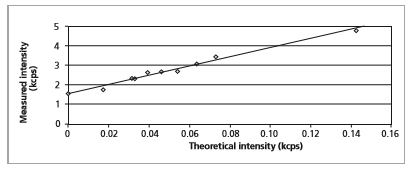
Figure 2. Calibration line for Ti Kα
Results of the repeated measurements are shown in Figures 3 and 4. Reproducibility results show excellent sensitivity and reproducibility as exhibited by the RMS values of stoichiometry and thickness.
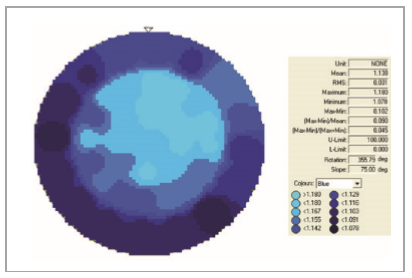
Figures 5 and 6 show the results of the 41-spot wafer mapping analyses. Wafer mapping results indicate a 0.623 Å thickness deviation and a 0.031 deviation in stoichiometry throughout the whole wafer. Results show the thickness and composition profiles throughout the whole wafer that resulted from the sample deposition process.
Figure 3. Reproducibility obtained for thickness measurements
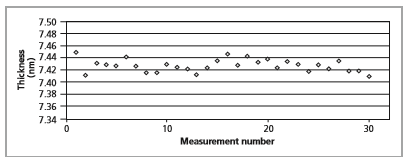
Figure 4. Reproducibility obtained for stoichiometry measurements
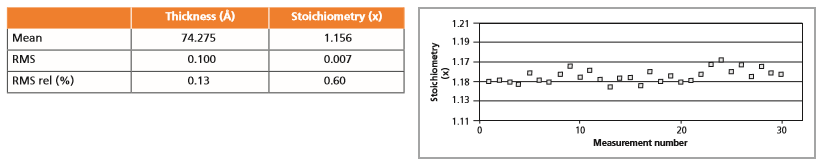
Figure 5. Thickness mapping of the wafer
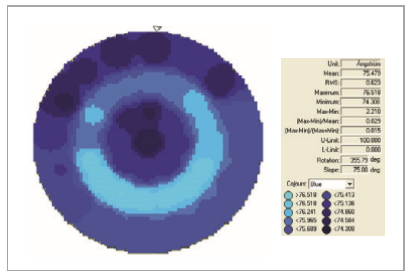
Figure 6. Stoichiometry mapping of the wafer
The PANalytical 2830 ZT XRF Wafer Analyzer, together with the fundamental parameter software package FP Multi, was used to analyze thickness and stoichiometry of TiNx layers. Results showed excellent reproducibility and sensitivity, indicating that 2830 ZT is well capable of measuring the thickness and composition of TiNx films. The typical thickness reproducibility is well below 0.2% relative RMS at 100 seconds measurement time.
The flexibility and reproducibility of 2830 ZT combined with FP Multi prove that this combination is an excellent metrology solution for monitoring the TiNx film deposition process.