
With the Morphologi® G3 particle characterization instrument there is never a lack of data, since information is provided in terms of different morphological parameters for every single particle measured. In addition distributions and statistics are available for each morphological parameter over a whole sample. The problem is then deciding which morphological parameter is most appropriate to use when comparing samples and looking for similarities and/or differences between them. An example would be when comparing several batches of a material from different suppliers. In order to overcome this problem the Morphologi G3 software offers an innovative statistical data analysis tool which allows rapid, objective analysis of multiple data sets allowing the user to quickly find which parameters are most relevant for different sample types.
The Morphologi G3's software provides a comparison tool which allows multiple results records to be selected and compared. A screen shot of the comparison tab is shown in Appendix 1. The tool provides a parameter variability bar chart which indicates which parameter varies most across the selected records, a dendrogram which clusters similar records together and a trend plot which may help when setting pass/fail criteria. These will be explained further using a typical example. Additionally the comparison tab also shows the over-plotted distributions for the selected records.
In many industries the ability to be able to identify bad batches of a material before they are used in a process results in improved productivity. For example, in the pharmaceutical industry it is useful to identify batches of excipient that may fail in a tableting process before expensive active ingredients are added. The challenge is to find a measurable parameter that identifies batches that may fail in the process so they can be rejected at an early stage. The ability to be able to compare many data sets quickly using the comparison tool may allow such a parameter to be identified and will help when setting pass/fail criteria for the material.
Six batches of excipient from different suppliers were compared using the comparison tool. This tool compares the distributions for all the morphological parameters measured by the Morphologi G3 across the selected records and displays a bar chart which indicates which morphological parameter is varying most (Figure 1). The parameter which shows the longest bar in the chart is the one for which there is most variation across the selected results and is automatically selected and indicated by bold text. For this example the solidity parameter was identified as varying most across the 6 batches compared. The comparison tool then displays a dendrogram which clusters similar results together based on the parameter selected in the variability section (Figure 2). So in this example the dendrogram clusters the results according to solidity. Therefore if several batches are being compared, it may be possible to identify outliers. If batches are similar in terms of their distributions for the selected morphological parameter the connecting bars on the x-axis will be short. The more the distributions vary across the batches according to the specified parameter, the longer the connecting bars on the x axis will be. By default the grouping in the dendrogram will be according the parameter that was found to vary the most across the samples in the parameter variability section.

|
However, any other parameter can easily be selected using the radio button next to the list of the morphological parameters. In this example, the dendrogram clustered the batches, according to the solidity parameter, into 2 main groups indicated by the blue and green lines.
Thus batches 4 and 6 were clustered into one group which was separate from batches 1, 2, 3 and 5. Within the cluster shown in green, batches 2 and 5 are very similar to each other in terms of solidity. Batch 3 is also similar to batches 2 and 5 but there is slightly more variation and next is batch 1, which is slightly more different again. Batches 4 and 6 however are similar to each other, but are different from batches 1, 2, 3 and 5 since they are clustered completely separately, as indicated by the different color. The comparison feature has therefore identified two batches that are different from the others according to solidity. If these are indeed problem batches, a suitable parameter may have been identified for monitoring batches and then the trend plot section of the comparison tool may assist in setting pass/fail QA/QC criteria.
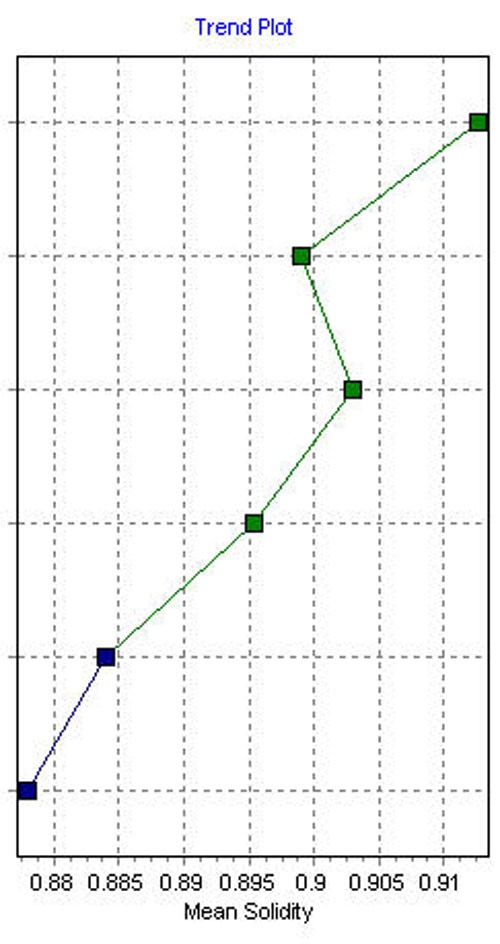
The trend plot displays the statistical mean value for each of the records according the specified morphological parameter so in this case for solidity (Figure 3). In the example it can be seen that the batches, indicated in blue, have a mean solidity below

|
0.885 whereas the batches, shown in green, all have a mean solidity greater than 0.895. A potential pass criteria therefore may be:
Solidity mean ≥ 0.89.
But what if the automatic clustering does not cluster the batches as expected, for example if the user already knew which were good and bad batches? The user could click on each parameter's radio button in turn, which would update the dendrogram to cluster in terms of each parameter, to see which ones do cluster the batches correctly. However, there is also a quicker way to do this by using the 'grouped' mode. To use the grouped mode the user gives the software some prior knowledge, thus which batches are expected to be grouped together, for example which are the good and bad batches. So for this example batches 1, 2, 3, and 5 are deemed as being 'good' and are labeled as belonging to group 1. Batches 4 and 6 are deemed as being 'bad ' and are labeled as belonging to group 2. The parameter variability chart now grays out the bars for parameters which cannot separate the groups correctly and leaves the parameters which can separate them correctly colored as shown in Figure 4. Thus the user now knows instantly which parameters are able to separate the batches correctly, in this case the parameters are Length, Maximum Distance, SE Volume, Circularity, HS Circularity and Solidity.
|

|
Advances in particle characterization mean that there is now a wealth of information available with results in terms a variety of size and shape parameters. Identifying which parameters are important for different sample types can be difficult and time consuming. The Morphologi G3's comparison tool allows a large number of data sets to be compared in terms of all the morphological parameters measured quickly and indicates which parameter is varying the most across those data sets. The tool then clusters the data sets according to how similar they are allowing the user to make informed decisions about pass/fail criteria.

|