
The Zetasizer Nano range of instruments uses the technique of electrophoretic light scattering for measuring the zeta potential of a sample [1,2]. The optical configuration of the Zetasizer Nano for zeta potential measurements involves passing a laser beam into a cell containing the sample and detecting the scattered light at a forward angle of 13°C. When an electric field is applied across the cell, any particles moving through the measurement volume will cause the intensity of light detected to fluctuate with a frequency dependent on the electrophoretic mobility of the particles.
The measured electrophoretic mobility (UE) is converted into zeta potential (z) through Henry's equation:
UE = 2 ε ζ F(κa)/3η (1)
where e is the dielectric constant of the dispersant, F(κa) is the Henry function and η is the viscosity [3,4].
The 13° forward detection angle used means that samples for measurement have to be optically clear for the laser beam to penetrate through the sample. If the concentration of the sample becomes too high, then the laser beam will become attenuated by the particles reducing the scattered light that is being detected.
The factors which will influence the concentration limits at which a sample can be measured at are the particle size, polydispersity of the size distribution and the optical properties of the particles. These are discussed in more detail in the technical note "Concentration Limits for Zeta Potential Measurements in the Zetasizer Nano" MRK 669-01 [5].
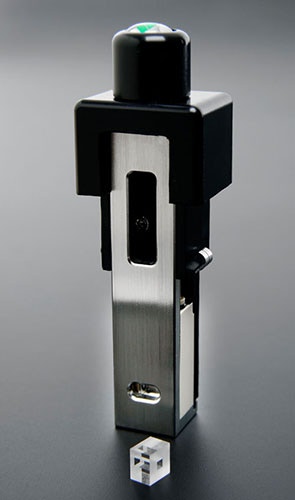
One way to measure the zeta potential of samples at higher concentration is to reduce the path length of the cell which will increase the transmission of the laser through the sample. The default cell used for zeta potential measurements in the Zetasizer Nano series is the folded capillary cell which has a path length of 4mm. The high concentration zeta potential cell (ZEN1010) incorporates a high precision quartz capillary with a reduced path length of 1.5mm (figure 1). This allows measurements of some materials to be made at concentrations of up to 40%.
|
Even though this cell allows electrophoretic mobility measurements to be made on concentrated samples, the conversion to zeta potential and subsequent interpretation of what the results obtained mean may not be straightforward.
This application note summarizes zeta potential measurements performed on a polyurethane dispersion (PUD) prepared at different concentrations to try and understand the concentration dependence on the measured electrophoretic mobilities.
Polyurethane dispersions are used in a variety of applications such as paints and coatings for plastics, metals and paper. This wide range of applications results from their properties and low impact on the environment.
A polyurethane dispersion at 40% w/v concentration was kindly provided by Baxenden, a Chemtura Company. Various concentrations were prepared in 5% v/v triethylamine to maintain ionic strength and ensure that any differences in the measured electrophoretic mobilities are not due to changes in conductivity.
All samples were measured on a Zetasizer Nano ZS at 25°C using the high concentration zeta potential cell ZEN1010. A field strength of 25V/cm was used. Five repeat measurements were made on each sample to check the repeatability of the results obtained. Sample viscosities were determined at 25°C using an SV-10 vibroviscometer [6].
Size characterization of a dilute polyurethane dispersion sample using dynamic light scattering [7] was made on a Zetasizer Nano ZS at 25°C.
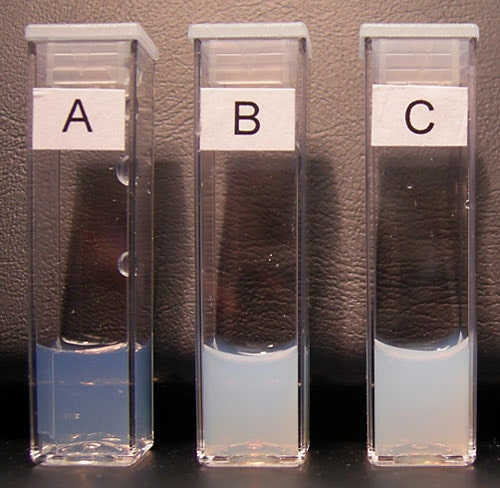
Figure 2 shows sizing cuvettes containing some of the concentrations of the polyurethane dispersion dispersed in 5% triethylamine used in this study. Even though the higher concentrations show very high turbidity, the ZEN1010 high concentration zeta potential cell allows successful measurements to be made.
|
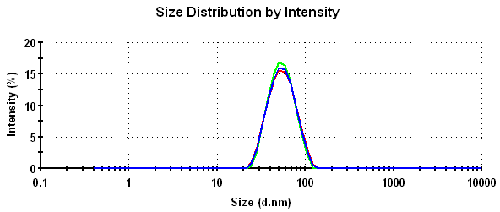
Table 1 summarizes the results obtained from the dynamic light scattering measurements made on a 1% w/v sample of the PUD prepared in 5% v/v triethylamine. Both the z-average diameter (the intensity weighted mean diameter) and polydispersity index are obtained from the cumulants analysis as defined in ISO22412 [8]. The intensity particle size distributions obtained from the 3 repeat measurements are over plotted in figure 3 and highlight the repeatability of the results obtained.
|
| Run | z-Average Diameter (nm) | Polydispersity Index |
|---|---|---|
| 1 | 50.6 | 0.103 |
| 2 | 50.5 | 0.095 |
| 3 | 50.3 | 0.106 |
| Mean | 50.5 (0.16) | 0.101 (0.006) |
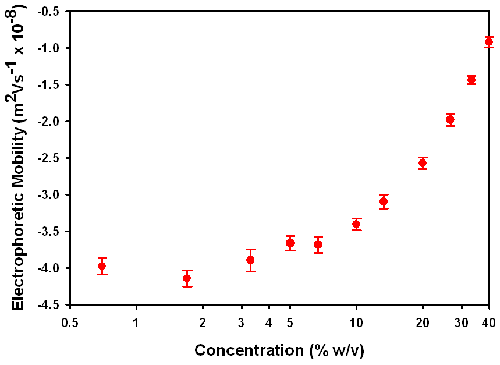
Figure 4 is a plot of the electrophoretic mobilities (m2/Vs x 10-8) measured as a function of sample concentration (% w/v) for the PUDs dispersed in 5% v/v triethylamine (apart from the neat concentration 40% w/v).
|
The polyurethane dispersion used in this study is ideally suited for looking at the influence of concentration on the electrophoretic mobility and hence zeta potential. Measurements can be made even at the neat concentration of 40% w/v with the high concentration zeta potential cell due to the particle size of around 50nm and the low polydispersity index values.
Figure 4 shows the electrophoretic mobility values obtained as a function of sample concentration. The values obtained at low concentrations are consistent (around -4.0 m2/Vs x 10-8)
However, at concentrations above 10% w/v there is a gradual decrease in the electrophoretic mobilities measured. This is not unexpected as the viscosity of the sample increases significantly with concentration.
Henry's equation (1) relates the electrophoretic mobility to zeta potential through Henry's function, the dielectric constant of the dispersant and the sample viscosity. In this study, an F(ka) of 1.5 (i.e. Smoluchowski's approximation) and the dielectric constant of water were used. The viscosities of the samples measured on the SV-10 vibro-viscometer were used to calculate the zeta potential values. The zeta potential results obtained from these calculations are plotted as a function of sample concentration in figure 5.
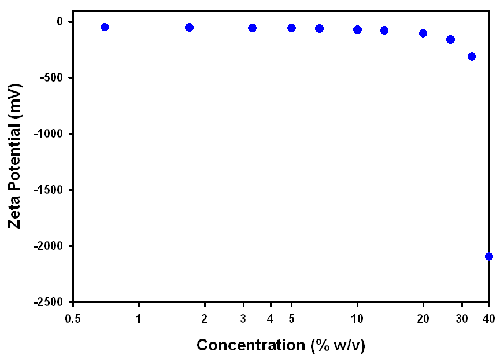
|
The zeta potential values at the higher sample concentrations are not realistic indicating that the viscosity values obtained from a simple viscometer such as the SV-10 vibroviscometer cannot be used. These polyurethane dispersions are complex samples exhibiting non-Newtonian behavior. Therefore, the correct viscosity value to use for the conversion of the electrophoretic mobility data into zeta potential values is very difficult to decide.
If the viscosity is assumed to be that of water for all concentrations of the sample, the zeta potential values obtained are more realistic (figure 6). However, there is still a concentration dependence in the values above 10% w/v.
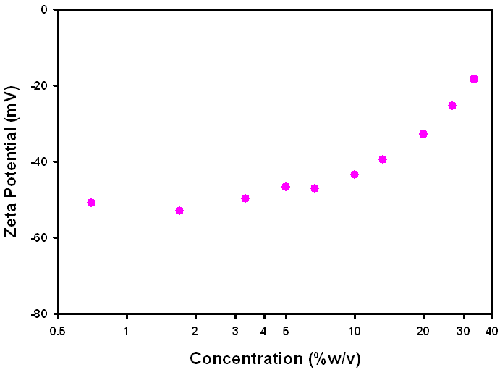
|
To understand the effects which are causing this behaviour we need to consider what could be causing a viscosity change and the non-Newtonian behavior of the sample. The average particle spacing becomes very small at high concentrations. At 40% w/v for example, the average particle spacing is of the order of 56nm. The thickness of the electrical double layer (the Debye length) can be calculated from the ionic strength of the dispersant. Theoretically, in 5% triethylamine, it will be of the order of a few nanometers and the combination of the interparticle spacing, and the electrostatic interactions could influence the electrophoretic mobility of the particles. The SV-10 applies a variable stress in the measurement, and as such is only applicable to Newtonian fluids. At higher concentrations where the material shows non-Newtonian behavior, the measurement by the SV-10 will not give an appropriate value.
The ZEN1010 high concentration zeta potential cell with its reduced path length allows measurements of samples up to 40% w/v. However, the concentration dependence in the results may be difficult to interpret. The electrophoretic mobility results show a gradual decrease as the sample concentration increases. The discussion becomes how to convert these measured electrophoretic mobility values into zeta potential.
The conversion through Henry's equation requires the viscosity of the sample to be entered. In a complex sample such as the polyurethane dispersion used in this study, it is difficult to know what the most appropriate viscosity value to use is. The results summarized in figures 5 and 6 show that assuming the viscosity of water results in zeta potential values which are more realistic than the use of bulk viscosities measured on a vibro-viscometer viscometer.
From the results obtained in this study, it can be concluded that zeta potential values obtained at high concentrations should be used in a relative, not absolute, sense. If the true zeta potential value of a sample is required, measurements should be performed at a range of concentrations to identify a region where the zeta potential results obtained are independent of concentration. For these experiments, the dilution protocol is pivotal to ensuring that sample conditions are kept constant.
[1] Measuring Zeta Potential Using Laser Doppler Electrophoresis, Malvern Instruments Technical Note MRK 570-01
[2] Measuring Zeta Potential Using Phase Analysis Light Scattering, Malvern Instruments Technical Note MRK 571-01
[3] Hunter, R.J. (1988) Zeta Potential In Colloid Science: Principles And Applications, Academic Press, UK.
[4] Measurement and Interpretation of Electrokinetic Phenomena (2005) Pure Appl. Chem. 77, 1753-1805.
[5] Concentration Limits for Zeta Potential Measurements in the Zetasizer Nano, Malvern Instruments Technical Note MRK 669-01.
[6] SV-10 Vibro-Viscometer, Malvern Instruments Technical Note MRK 650-01.
[7] Dynamic Light Scattering - An Introduction in 30 Minutes, Malvern Instruments Technical Note MRK 656-01.
[8] International Standard ISO22412:2008, Particle Size Analysis, Dynamic Light Scattering, (DLS)