
The Quality factor was introduced into the Zetasizer software as an aid to running zeta potential measurements in a consistent way. The measurements are made by summing together data taken as 'sub runs' (which for convenience will be simply referred to as runs) until the result is sufficiently accurate to stand as a measurement. Since the measurement of electrophoretic mobility is intrusive, in the sense that the passage of the electric current needed to generate the field may alter the sample after a time or cause the electrodes to be 'aged', it is not desirable to run an arbitrarily long measurement. Empirically it has been found that a measurement period in the range of 10 to 100 runs should usually be suitable.
The quality factor is a test of the phase data which measures the signal/noise ratio. The phase data to determine the mean mobility is taken while the field is reversed rapidly, the so-called FFR measurement. The signal produced is a sawtooth waveform with a frequency equal to the field reversal frequency.. A frequency analysis of the phase data is performed which has a peak at the FFR frequency and the quality factor is related to the area of this peak.
A poor signal will give a low peak area or no peak at all, and a better signal will give a larger peak. The calculation is scaled such that an acceptable signal will give a peak area value, or quality factor of 1, and very good signals will give higher values.
For a sample of very low or zero mobility there will be no peak and the quality factor would also be zero. So the difficulty of measuring mobility is itself dependent on the value of the mobility. This note presents measurements using the folded capillary cell made using samples of different 'effective' mobilities over a similar number of runs (50) and demonstrates the relationship between the mobility and the quality factor achieved. In fact, as samples of different but 'known' mobilities, especially low values of mobility, are not readily available, what was done was to conduct measurements of 'known' samples at lower than normal applied field values so simulating the existence of samples of known mobility. So, for example, a sample of latex dispersed in a salt solution that has been established to have a mobility of around -4.0 m2V-1s-1 x 10⁻⁸ when measured using a field of 50 volts can be measured with a the voltage reduced to 1 volt. The data should then be similar to what would be expected for a sample of mobility -0.08 m2V-1s-1 x 10⁻⁸. In fact, the situation is not exactly equivalent as the reduction in the field will also reduce the intrusiveness of the measurement. Hence the quality factor obtained may be higher than realizable for a sample of that mobility with the usual field applied. However, by carrying out the procedure over a range of conductivity values, the importance of the effect can be estimated and a useful insight obtained.
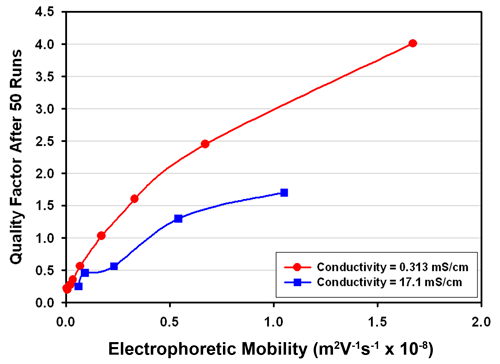
The results for samples of conductivity 0.313 and 17.1 mS/cm are shown in Figure 1. It can be seen that for the lower conductivity set, a quality factor of 1 is achievable for samples of mobility larger than about 0.1 m2V-1s-1 x 10⁻⁸. This corresponds to a zeta potential value of around 1.3 mV for a typical aqueous based sample. At the higher conductivity, a quality factor of 1 is obtainable for samples of mobility around 0.4 m2V-1s-1 x 10⁻⁸, or zeta potential of 5 mV. However the mobility value was correct to within 10% of expected value in this case when the quality factor had reached 0.5 and achieved 5% accuracy when the quality factor is 1.
|
Therefore, even under these more difficult measurement conditions, the standard acceptance test for run length is likely to achieve a result accurate to around 5%, and for more usual samples the accuracy would be expected to be significantly better.