
|
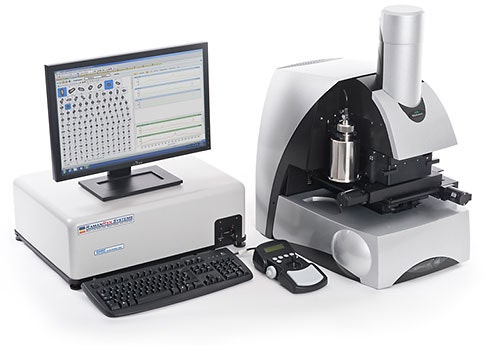
The Morphologi G3-ID (Figure 1) combines the capabilities of a Morphologi G3 particle analyzer with the Kaiser RamanRxn1 spectrometer resulting in a single platform measuring particle size, shape and chemical identity. The Raman spectrometer uses a 785 nm laser allowing the spectral range 150 cm-1 to 1850 cm-1 to be acquired with a 4 cm-1 spectral resolution. The spectrometer accessory is coupled using fiber optics to the Morphologi G3 allowing Raman spectra to be acquired.
In addition to reporting the standard morphological parameters, the Raman capability on the Morphologi G3-ID enables the chemical identification of particulates in a dispersed sample. In a situation where particles in a multi-component sample all present a similar morphology, chemical information might be the only way to distinguish between the particles of interest for evaluation. The extra chemical information permits creation of chemical classifications from which component- specific particle size distributions are determined. This can provide extra compositional information about samples that can be invaluable in research and development or investigative situations.
The workflow of the Morphologi G3-ID can be broken down into three stages:
The first step in the Morphologi G3-ID measurement is to perform a morphological image analysis on the dispersed sample. This step is exactly the same as for measurements with the Morphologi G3. Therefore, a prerequisite for successful analysis is that the sample must be suitable for measurement on the Morphologi G3.
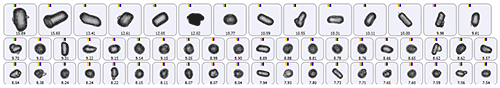
The Morphologi G3 saves an image of every particle analyzed; Figure 2 shows some example particle images from a dispersed nasal spray sample. Information about the position, size, shape and intensity is calculated and saved for every particle analyzed. The positional information makes it possible to return to any particle, as long as the sample remains undisturbed. Automated Raman measurements use this information to acquire spectra from a set of particles.
|
Raman spectroscopy is a light scattering technique based upon the interaction of monochromatic laser light with the sample of interest. Typically, light is scattered by a molecule with no change in energy, but approximately 1 in 10 million scattering events result in a change in the energy of a photon; this is the Raman effect. The rarity of Raman scattering events make it an inherently weak effect, but it allows minimal or no sample preparation.
Raman has high molecular specificity with sharp distinctive spectral peaks providing information about the molecular vibrations in a sample.
Therefore, Raman spectroscopy is capable of distinguishing between closely related chemical species.
|
Raman spectroscopy is commonly used with organic materials since it is sensitive to vibrations of molecular bonds. It is also useful for some inorganic materials, but is typically not suitable for metals or very dark materials if they strongly absorb around 785 nm.
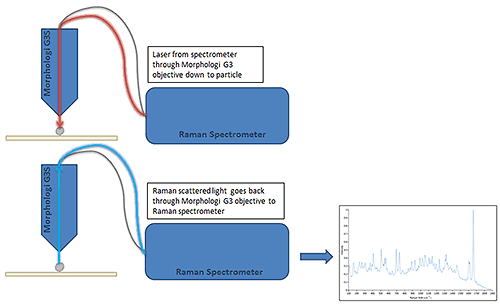
The Morphologi G3-ID automatically acquires Raman spectra by returning to selected individual particles. The 3 µm laser spot is targeted at the center of mass of each particle with the 50x objective and the Raman scattered light collected. Figure 3 shows a schematic of Raman spectral acquisition.
The particle size range that can be measured depends on a number of factors including: how strong a scatterer the material of interest is; the sample preparation method and the environmental temperature stability. Typical acquisition times are between 5 to 30 seconds depending upon the particle size, and the signal-to-noise ratio of the Raman spectrum.
The Morphologi G3 morphological results can be filtered and classed using the size and shape related parameters which can help optimize targeting particles of interest for the chemical measurement. Particles can be selected for chemical analysis manually from the particles view, or automatically according to user determined selection rules.
|
Once the particle spectra have been acquired, the chemical analysis performs a correlation calculation to measure the strength of association between the resultant particle spectrum and the library of reference spectra. Correlation scores between 0 and 1 are reported, where a score of 0 means no correlation and a score close to 1 is a strong correlation to the library spectrum.
Typically a reference library is composed of spectra from known components expected to be present in the sample. The library can be compiled in two ways: manually from point spectra acquired in manual microscope mode using pure reference materials, or retrospectively from particle spectra acquired from the actual sample if "pures" were not available initially.
Reference libraries can be edited and the sample data re-analyzed with a new library if appropriate.
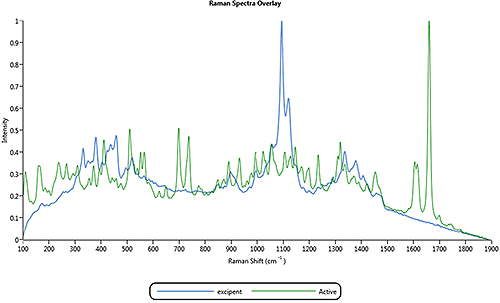
The application example described in this appendix is for a nasal spray formulation that contains an active component and an excipient component. Figure 4 shows the overlay of the two library spectra of particles for the active and excipient components in the nasal spray formulation.
|
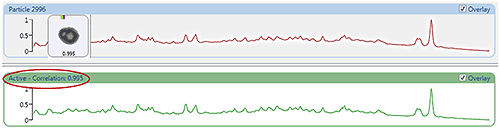
Figure 5 (top) shows the Raman spectrum from a particle measured in the nasal spray sample with the reference library spectrum (bottom). The correlation score of 0.995 indicates the particle spectrum shows a good correlation to the reference. The correlation scores can be used to create chemical classifications for the sample data in order to separate components.
Correlation scores can be calculated over the entire spectral range, or the range can be limited to include only regions of interest. For the example application, the primary interest is to identify active particles in order to generate the 'active only' particle size distribution. In this case limiting the spectral range to 1500 cm-1 to 1800 cm-1 optimizes the correlation calculation to achieve the aim of the application.
Additionally the spectral data can be pre-processed using a number of different derivative settings, which may help enhance the signal-to-noise ratio and minimize baseline artifacts in the acquired spectra.
Particles of interest can be investigated in more detail manually using the manual microscope option within the Morphologi G3 software. As long as the dispersed sample remains undisturbed, it is possible to return to any of the particles analyzed. This allows the user to change the magnification and lighting conditions as well as perform manual point capture of Raman spectra. Capturing point spectra is used for method development when deciding what spectrometer settings are required to optimize the Raman signal obtained from the sample. It may also be used for acquiring the reference spectra from the "pure" components for the library.
The Morphologi G3-ID is a powerful tool, providing information not available from other, more traditional, Raman based techniques such as:
|
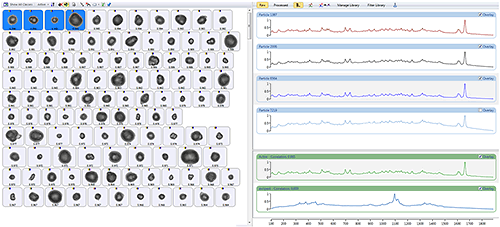
Once the Raman data has been acquired, the particles can be sorted according to their chemical correlation to the library components. Figure 6 shows particle images from the nasal spray sorted by their correlation to the active component. The four particles with the highest correlation scores are selected to show their spectra in the stacked view along with the library spectra.
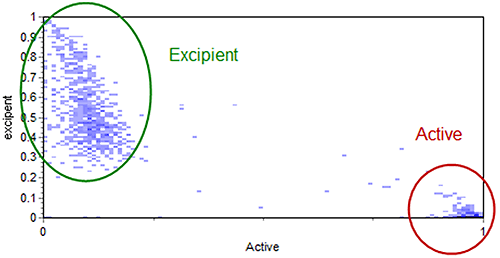
The scattergram function, used to relate standard morphological parameters obtained in a Morphologi G3 measurement, can also be used to relate different Raman correlation scores. This can aid visualization of the different chemical populations and help with the subsequent chemical classification of the particles. The scattergram in Figure 7 shows the relationship of particle correlation to the active and excipient references for the example data. Figure 7 also indicates how the particles were chemically classed.
|
|
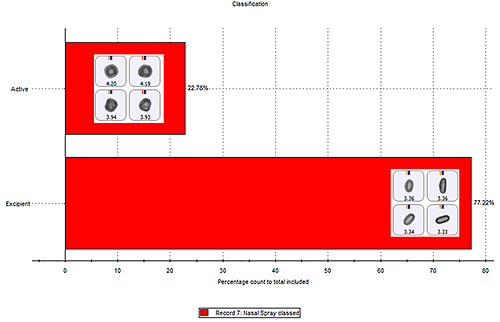
The contribution of each class within a sample, relative to each other, can be compared using the classification chart function. Figure 8 shows a classification chart (in percentage count) for the chemical classes in the nasal spray example with some particle images from each class. The classification chart can be viewed by particle count, showing the actual number of particles found in each class; percentage count; or percentage volume, which can be useful when comparing different samples with varying numbers of particles analyzed.1
(For quantitative results, detailed method development from sampling through to chemical acquisition is required; otherwise results should be viewed as semi-quantitative.)
|
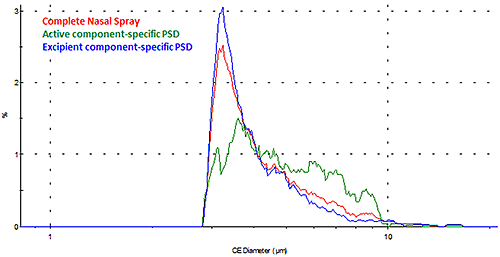
For some applications, the interest may be in obtaining the morphological information for a specific component within the sample dispersion. A new record can be created for each chemical class, which enables the user to perform component-specific particle analysis. Figure 9 shows the overlay of the particle size distributions (PSDs) for the individual active and excipient components as well as for the overall nasal spray formulation in terms of number (where every particle has equal weighing).
|
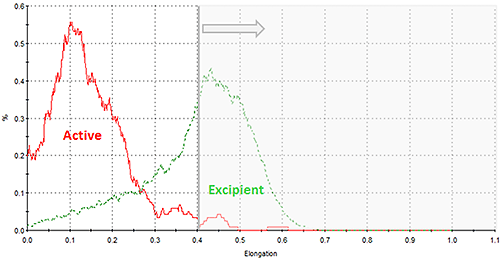
As with all Morphologi G3 results, distributions for all the morphological parameters calculated for the particle images are reported. Figure 10 shows an overlay of the elongation distributions for the two nasal spray components which indicates differences between them. In this case, particles with an elongation value of greater than 0.4 are not likely to be the active component; the component of interest. In the morphological analysis a filter can be applied to exclude particles with elongation values greater than 0.4 improving the targeting for the Raman acquisition towards the active component only. Optimising the particle targeting towards the component of interest in this way reduces the overall measurement time.
Alternatively, the reference materials could be analyzed independently and their particle morphology evaluated to optimize the targeting of the Raman acquisition.
There may be applications where particles with unknown identities are present in the sample. For example: as a result of sample contamination or due to the presence of unknown polymorphs of a substance. In these situations, where no "pure" materials are available to use as the references, the usual procedure is to compare any unknown spectrum or spectra of interest to a spectral database.
Commercial databases contain a wide selection of reference spectra which may allow identification of the unknown, or give a better understanding of what it might be.
To enable the use of third party spectral databases, the particle spectra can be exported from the Morphologi software in industry standard file formats such as .spc or .csv.