Size-exclusion chromatography (SEC) is a commonly used tool in the biological sciences. Typically, it is used to measure the molecular weight of an unknown sample by referencing the elution time of the unknown against that of standards of known molecular weight. This can be done with a single concentration detector such as UV or refractive index (RI). Advanced multi-detector SEC systems now include up to four detectors including UV, RI, light scattering and intrinsic viscosity. Light scattering detectors allow the measurement of molecular weight without the need for column calibration. Intrinsic viscosity is a measure of molecular density and enables structural changes to be assessed. A combination of light scattering and intrinsic viscosity allows size to be calculated.
|
Maintaining the detectors in series is essential for maintaining maximum sensitivity across all four detectors.
SEC is generally used to measure pure samples. In this application note, a mixture of four proteins was characterized in a single SEC measurement using multiple detectors. The generally consistent response to the RI to proteins makes it a useful total protein concentration detector, while the UV detector can be used to measure the concentration of individual proteins when the extinction coefficient is known. This is particularly useful for proteins that elute in the solvent peak making RI measurements unreliable. Finally, light scattering measurements allow each peak to be identified by its molecular weight.
The four protein samples used were Glucose Oxidase, Lactoperoxidase, Lactoferrin and Lysozyme.
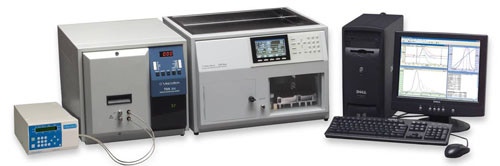
The samples were run in phosphate buffer pH 4.5 as the recovery was found to improve at this pH for two of the proteins. Silica-based Viscogel P-columns were used and the measurements were made on the Viscotek TDAmax system, a tetra-detection system with UV, RI, light scattering and intrinsic viscosity detectors in series.
A dn/dc of 0.185 ml/g was used for all of the samples. An extinction coefficient (E280 1 mg/ml) of 2.64 was used for Lysozyme.
Samples were run at 3 mg/ml alone and at 0.3 mg/ml each when mixed. Injection volumes were 100 μl.
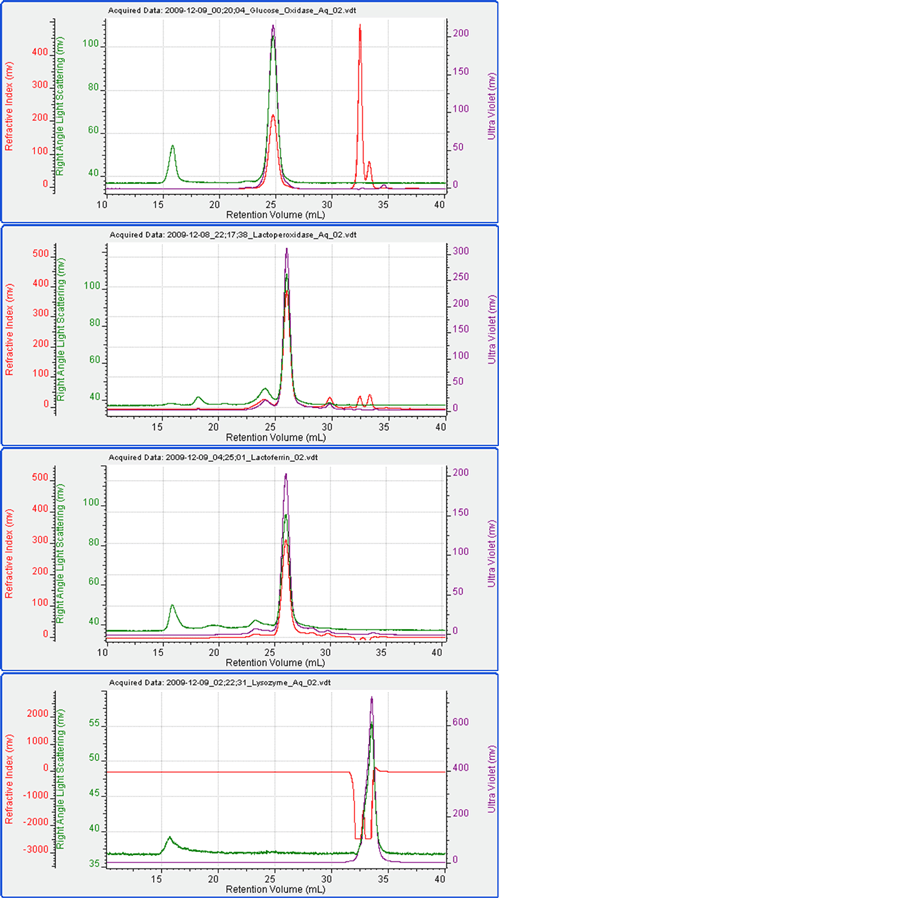
Each of the four enzymes was run separately to measure their elution time and molecular weight for comparison with the experiments containing mixtures.
Figure 2 shows the chromatograms for each of the four proteins measured alone. Table 1 shows the measured data including elution time, molecular weight and peak areas for the detectors.
|
| Stated molecular weight (kDa) | Measured molecular weight (kDa) | RI peak area (mV ml) | |
|---|---|---|---|
| Glucose Oxidase | 160 | 134.5 | 20.6 |
| Lactoperoxidase | 78 | 77.7 | 28.71 |
| Lactoferrin | 80 | 83 | 28.05 |
| Lysozyme | 14.7 | 14.7 | N/A |
It can be seen that under these conditions, the four proteins ran well. The measured molecular weights were close to expectations. The only exception to this was that the molecular weight of glucose oxidase was measured to be 130 kDa as opposed to the expected value of 160 kDa. The difference for this was not investigated here but it suggests some kind of modification. Lysozyme eluted in the salt/solvent peak where there was a significant effect on the RI signal. Consequently, the UV signal was used to measure the Lysozyme concentration for the molecular weight calculation.
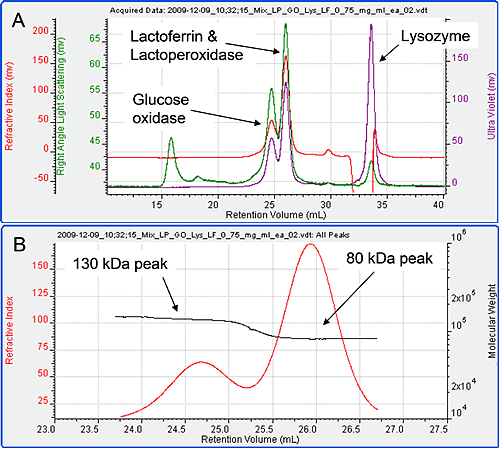
Figure 3 shows the chromatogram from the four samples mixed together in equal amounts. Only three peaks are visible in the resulting chromatogram. Intuitively, it seems likely that the first peak is Glucose Oxidase, the second a combination of the Lactoperoxidase and Lactoferrin and the third Lysozyme, but the detector signals and results can be used to confirm this unequivocally. The molecular weights of the three peaks were studied. The first was found to have a molecular weight of 130 kDa while the second was 80 kDa. The third was measured to be 15 kDa identifying it as Lysozyme. The first two peaks have only been partially resolved.
|
Plotting the molecular weight distribution across the two peaks (figure 3B) allows the monodisperse regions to be clearly identified and their molecular weights accurately measured, thus, clearly identifying the peaks. The first peak is therefore, clearly Glucose Oxidase.
The second peak is either lactoperoxidase, or lactoferrin or both. The dn/dc of unmodified protein is generally constant at 0.185 ml/g. Therefore, the RI signal can be taken as a measure of total protein. The RI peak area for peak 2 on this chromatogram is 55.43 mV ml. This is very close to the sum of the RI peak areas in when the two proteins Lactoferrin and Lactoperoxidase were run alone (28.7 + 28.05 = 56.75 mV ml) at similar concentrations. It can therefore be concluded that the second peak is indeed the comprised of both lactoperoxidase and lactoferrin.
The combination of multiple detectors allows more information to be extracted from a single chromatogram than if one was used alone.
Firstly, in protein mixtures, RI can be used as a measure of total protein allowing quantification of protein independently of individual protein extinction coefficients. Secondly, UV is useful when very small proteins such as Lysozyme elute in the solvent peak that often accompanies the end of a run. Thirdly, the use of light scattering to measure molecular weight allows partially resolved peaks to be clearly identified.
Overall, multi-detector SEC is a significant improvement over single detector systems. The molecular weight can be measured without the need for column calibration, mixtures can be resolved with greater tolerance and the useful region within a single chromatogram can be extended beyond what was previously possible.