The principal source of energy in milk is the disaccharide named lactose. The enzyme responsible for hydrolyzing the lactose disaccharide is beta-galactosidase. Lactase is a member of the b-galactosidase family of enzymes.
A proportion of the population produce less lactase in adulthood. This proportion ranges from 5% in northern Europe to as high as 90% in some African and Asian countries. The resulting lactose intolerance can cause vomiting, stomach ache and diarrhea.
The study of size and stability of lactase is interesting, as a wide range of sizes and molecular weights have been reported in the literature.1,2
Dynamic light scattering (DLS) is a physical method for measuring the size of small particles suspensions or macromolecules in solution. Since the analyte in solution is moving randomly due to Brownian motion, interference in the scattered light from numbers of particles creates intensity fluctuations. In a DLS measurement, the time dependent fluctuation in scattered light is recorded using a single photon counting avalanche photo diode. A digital auto-correlator is used to extract the correlation function, from which the size and distribution of sizes are calculated.
DLS requires a measurement angle to be chosen. Low forward angle measurements are prone to dust interference and are harder to use. Measurements at forward angles are reserved for experiments where the maximum sensitivity is required for aggregate detection. The classic measurement angle is 90 degrees as this has a number of advantages, but minimizes the scattering volume. This means fewer particles are observed, hence limits the sensitivity of the instrument. A backscatter angle increases the sample detection volume, shortening the measurement time and improving the sensitivity while minimizing the effects of dust.
Commercially produced lactase from Aspergillus oryzae was chosen for characterization. The samples were dissolved in phosphate buffered saline (PBS) for 30 minutes before use, then filtered using a 5µm filter.
The chromatography system used was an Agilent 1200 series. The eluent contained 0.1M sulfate and 0.1M phosphate with 0.05% sodium azide to avoid bacterial growth. The solvent was vacuum degassed and filtered using 0.1µm Anotop filter in a glass bottle and the flow rate set to 0.5 ml/minute. The injection loop was 50 µL. The separation was done at 25°C in a single Tosoh G3000SW XL column which is designed for SEC use.
The same Malvern Instruments Zetasizer Nano-S was used for batch DLS measurement as well as for SEC measurements of the enzyme. Since no calibration of the instruments is required, the method is said to be absolute. Characterization using SEC coupled with DLS is given the acronym SEC-DLS.
In flow mode, the Zetasizer was placed after the existing UV detector, while for batch measurements, the flow cell was removed and disposable plastic cuvettes were used.
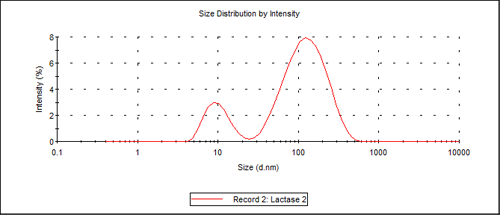
For batch measurements of freshly prepared samples, two size populations were observed, the first one at 10.3nm and the second one at about 140nm. The limitation of size separation of two populations for batch DLS is about a 3:1 difference in the mean sizes, so any monomer-dimer system cannot be resolved using DLS without prior separation, as these differ only by a factor of about 1.3 in their hydrodynamic size. Figure 1 shows the distribution by intensity of the 2 peaks.
|
Using the protein utility of the Malvern Instruments Zetasizer software, the protein weight estimated for a 10.3nm molecular diameter protein is 156 kDa (156,000 g/mol). This molecular weight is consistent with the values reported in the literature.2, 3
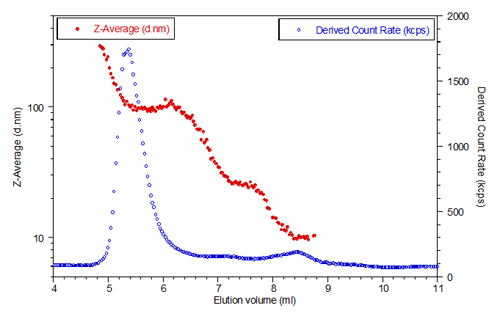
Lactase was also studied using SEC-DLS and result of measurement is presented in Figure 2.
|
The lactase eluted between 4mL and 11mL so only this part of the chromatogram is presented. The blue circles represent the scattering intensity, or derived count rate, measured by the instrument. The derived count rate is the total scattering intensity taking into account any attenuation, so it represents the true count rate over a very wide dynamic scattering range. The red circles are the hydrodynamic size measured for each elution slice. The system was set to measure the size every 3 seconds.
The chromatogram shows aggregated lactase eluting first around 5-6 ml. Hydrodynamic diameters of up to 300 nm are recorded for the largest aggregates, with a plateau around 100 nm diameter which is consistent with the largest size peak measured in batch mode.
The chromatogram also shows lactase aggregated with the size ranging from 100 to about 25 nm. These aggregates scatter much less as shown by the scattering intensity (blue curve). The scattering intensity plot shows a bump around 8.5 ml which is monomeric lactase. The hydrodynamic diameter measured for the monomer is constant with an average value of 10.15 nm.
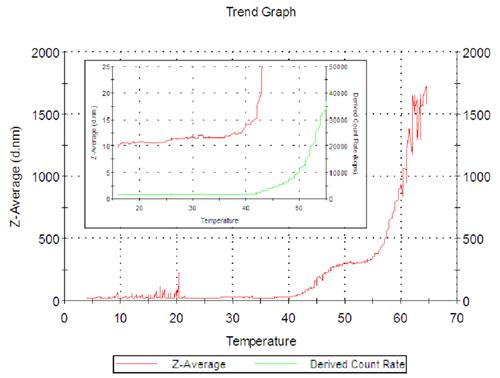
The temperature stability and denaturing of the protein was also studied. Figure 3 shows the Z-Average (hydrodynamic diameter in nanometers) Vs temperature for the enzyme freshly filtered using a 0.02µm[MC1] Anotop filter.
|
The Z-Average size of the enzyme increases from 40ºC then denatures quickly above 55ºC..
This behavior is interesting as it shows a stable or semi stable conformation as a plateau in the trend, with a size of 300nm at about 50 ºC.
In figure 3, the inset graph shows the count rate in green as well as the Z-Average size. This is a repeat of the previous experiment but terminated at 55ºC. The greater detail shows the size of the enzyme increasing from 10 to 12 nm between 20º and 40ºC, an indication that there is some change in conformation of the lactase in PBS buffer. There is a sharp increase in size above 40ºC as noted before.
The size of lactase solution in PBS was measured over a period of time to verify the stability. A 0.02 micron Anotop filtered sample was measured over a period of 18 hours. The sample size grew during this time from a single peak around 10 nm to give two populations, one still about 10 nm and another one around 250 nm, showing again the existence of a stable higher state of aggregation of lactase in PBS.
[1] J. Potter M.-W. Ho, H. Bolton, A. J. Furth, D. M. Swallow & B. Griffiths, Biochem. Genet. (1985) 23, 423-439
[2] H. K. F. Lau, Biochem. J. (1987) 241 567-572
[3] G. M. Gray, N. A. Santiago, E. H. Colver, and M. Genel, J. Clin. Invest. (1969) 48(4) 729-735