Sucessful production of robust ceramic components is highly dependant on the particle size distribution of powdered ceramic and the degree of particle dispersion achieved during green body formation. This can be assessed using laser diffraction.
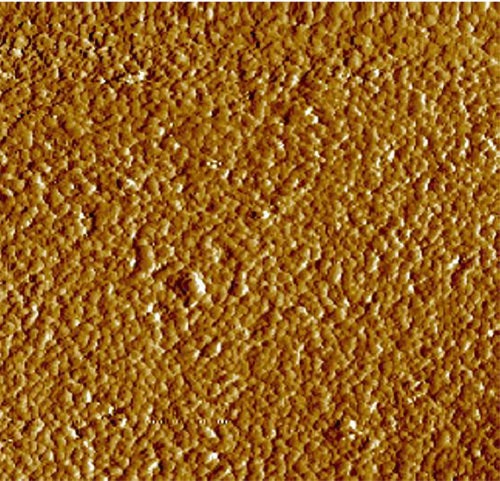
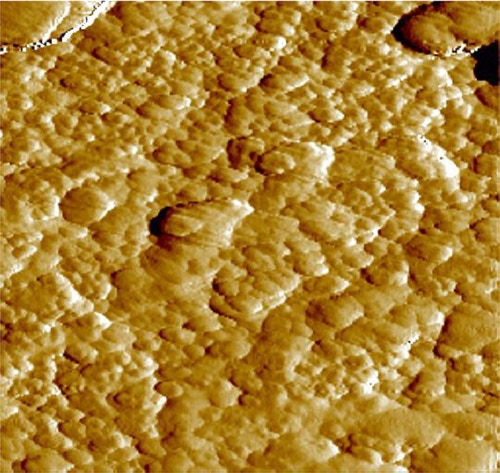
The production of modern ceramic components generally involves two separate processing stages. First, powdered ceramic is dispersed in a liquid and then compacted to form the desired component shape or "green body". The green body is then heated to just below the melting point of the ceramic material. At this temperature sintering occurs, causing the particles in the green body become bonded together (figure 1). This process creates a mechanically strong component.
The production of robust ceramic components is highly dependant on the physical properties of the powdered ceramic and how it disperses during green body formation. One of the most important quality control parameters is the ceramic particle size and size distribution. The particle size can help define the time and temperature required to attain full density during sintering, with finer particles requiring shorter sintering times due to their high surface area. A direct relationship is also known to exist between the particle size and the pore size observed in the green body prior to sintering. Large particles tend to pack inefficiently, leading to the formation of large pores which persist during sintering, increasing the probability of component failure. Pore formation can be controlled, however, by either using powders with smaller particle sizes or by using polydisperse size distributions where the fine particles within the powder fill the voids between the larger particles. Finally, the presence of large agglomerates must be avoided as these can lead to defect formation during sintering, as agglomerated grains tend to grow more quickly than well-dispersed particles. Again, this reduces the strength of the ceramic component. Reliable particle size analysis is therefore an important requirement as part of ceramic component development and production control.
Many different techniques have been used to verify the particle size distribution of ceramic powders. Of these the technique of laser diffraction, as used in the Mastersizer, offers unique advantages due to its ease of use and fast analysis time. The dynamic range covered by the Mastersizer is extremely broad, allowing both well-dispersed particles and agglomerates to be easily detected within a single measurement. Laser diffraction is a volume-based technique i.e. it reports the volume of particles which have a given particle size. This makes the technique extremely sensitive to the presence of large particles as, although they may be present in a powder in small numbers, they contain a large volume of material compared to finer particles (one 100 µm particle contains the same volume as one million 1 micron particles and therefore yields the same response in the diffraction system). This makes the technique ideal for monitoring the state of dispersion within ceramic slips.
|
|
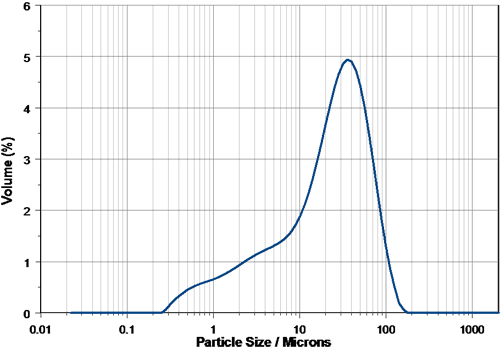
It is important that any technique used for measuring ceramic particle size distributions is sensitive to the presence or large particles or agglomerates. ISO13320-1, the international standard for laser diffraction measurements, suggests that the sensitivity of the technique can be tested by determining how the system responds to the addition of small amounts of one material in the presence of another. This test has been carried below for a relatively coarse ceramic product (figure 1). The particle size of this material was determined with a measurement variability of less than 1% - this low variability shows the robustness of the Mastersizer system and is important as it defines the experimental limit of detection of any "problem" particles. The ability of the system to detect small changes in the volume of material at the coarse end of the distribution was determined by seeding the ceramic powder small amounts of larger particles.
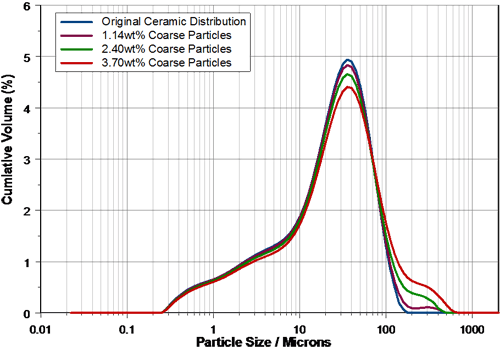
The ability of the Mastersizer track agglomeration within the ceramic powder was determined by adding known weights of a coarse particle fraction (particle size >90 mm). Figure 2 shows the particle size distributions reported by the Mastersizer during the addition of the coarse material. As can be seen, the presence of the coarse fraction was detected at the lowest concentration (1% by weight).
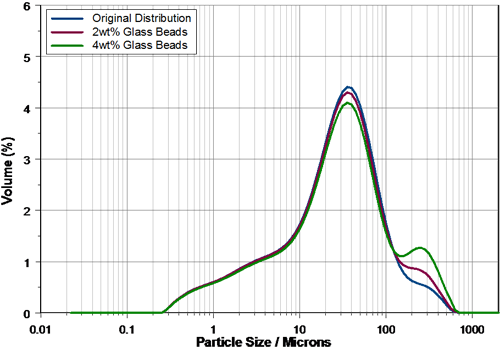
Further testing was carried out by adding know amounts of 225 µm glass beads to the powder in order to model the presence of over-sized, unmilled material. The particle size distributions reported by the Mastersizer are shown in Figure 4. Again, the Mastersizer detected the presence of the large particles at the lowest concentration used. These results demonstrate that the instrument was able to track the concentration of dope material accurately.
|
|
Accurate measurement of ceramic powder particle size distributions is important in the production of modern ceramic components. The Mastersizer has proved to be very sensitive to the presence of oversized particles in the ceramic powders tested. Over-sized materials were detected at the lowest concentrations used in the experiments described here. The technique therefore represents a valuable tool in determining the particle size and state of agglomeration of ceramic powders. This, in turn, can lead to reduced defect formation, allowing for more consistent production of ceramic components.
Many thanks go to Prof. Jim Adair at Penn State University for providing the micrographs shown in figure 1.
|