Two different proteins [Immunoglobulin G IgG and human serum albumin HSA] are measured using a series of static (SLS) and dynamic (DLS) light scattering measurements. The molecular weight, 'true' hydrodynamic diameter, second virial coefficient, and DLS interaction parameter are measured.The results show that both SLS and DLS measurements can be used to study interactions between proteins, as well as simply their molecular weight and hydrodynamic size. The values of A2 and kD can be seen to change in response to a change in buffer pH.
Biopharmacueticals are a rapidly growing type of medicine where the active ingredient is a protein rather than a small molecule. The most common biopharmaceuticals are monoclonal antibodies (mAb). One of the key challenges in biopharmaceutical development is the correct formulation of the drug. The Commercial Target Profile for these biotherapeutics generally calls for high concentrations, in order to accommodate a dosage schedule consisting of a single daily user administered subcutaneous injection, as well as an expected shelf life of up to 2 years. A 'good' formulation then, would consist of the biologic at high concentration within a formulation exhibiting low viscosity and a low aggregation propensity [1]. Creating a drug formulation where these goals are met can be very difficult; therefore, advancing our understanding of the relationships and processes that result in high formulation viscosities or aggregation rates is of great importance. Beyond this, the ultimate goal is to be able to predict the sample behaviour at high concentration, based upon measured dilute solution properties early in the development cycle. By doing this, the cost and risk of formulation development of biopharmaceuticals can be significantly reduced.
Two parameters that are becoming increasingly studied with respect to predicting biopharmaceutical behaviour in formulation are the second virial coefficient (A2) and the dynamic virial coefficient, or DLS interaction parameter (kD) [2, 3].
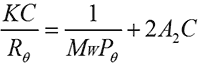
A2 is routinely measured using SLS. In a batch (cuvette-based) SLS measurement, the sample is prepared at a series of different concentrations. The light scattering intensity from each sample is measured. The scattering intensities are referenced against a light scattering standard, typically toluene. The results are used to build a Debye plot using the Zimm equation (shown below) where K is a constant, C is the sample concentration, Rθ is the Rayleigh ratio (the ratio of scattered light to incident light), A2 is the second virial coefficient, Mw is the sample molecular weight and Pθ is the angular scattering dependence. For isotropic scatterers such as proteins, Pθ is approximately equal to 1 and can be ignored.
|
|
In a Debye plot, KC/Rθ is plotted as a function of sample concentration and the sample molecular weight and A2 are then calculated from the y-intercept and slope, respectively. A2 has previously been shown to have a strong correlation with sample solubility. If a sample has a negative A2, then the sample will tend to aggregate and come out of solution over time, whereas with a positive A2, a sample is more likely to stay in solution. A2 has therefore been used as a measure of sample stability; however, there is a growing recognition that this value may also have wider reaching applications related to sample viscosity [3].
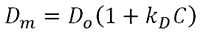
The DLS interaction parameter, kD, is measured using DLS and is calculated from the concentration dependence of the measured diffusion coefficient of the sample [4], as indicated in the expression below, where Dm is the mutual (measured) diffusion coefficient , D0 is the self diffusion coefficient (the diffusion coefficient at zero concentration), and C is the sample concentration .
|
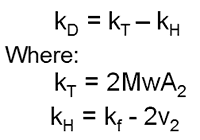
kD is defined as:
|
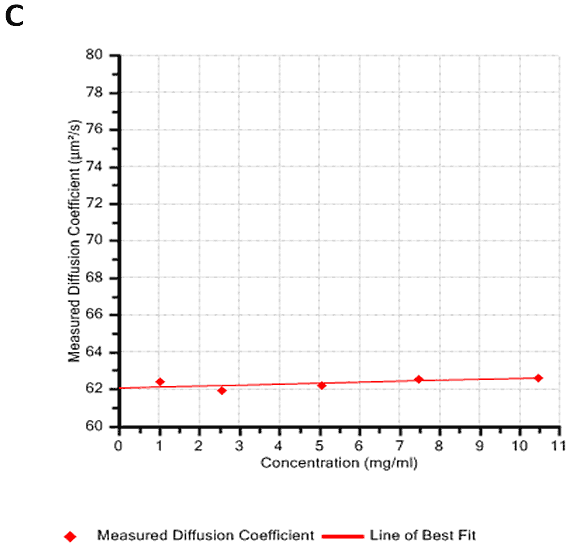
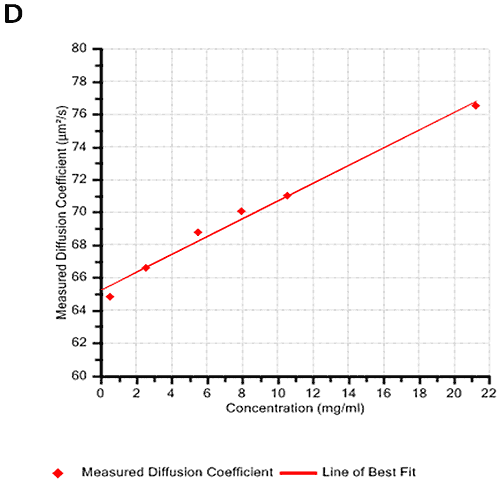
where Mw is the molecular weight, A2 is the second virial coefficient, kf is the first-order concentration coefficient in the virial expansion of the frictional coefficient and ν2 is the partial specific volume of the protein [4]. Effectively, kT is a thermodynamic component dependent on A2 and kH is a hydrodynamic component dependent on partial specific volume. When A2 is close to zero (theta conditions), kD is dominated by the hydrodynamic component which is more dependent on size and structure than inter-molecular interactions. A dynamic Debye plot plots Dm as a function of C. The intercept is the diffusion coefficient (D0) and from this the "true" hydrodynamic size is calculated. kD is calculated from the slope of the line.
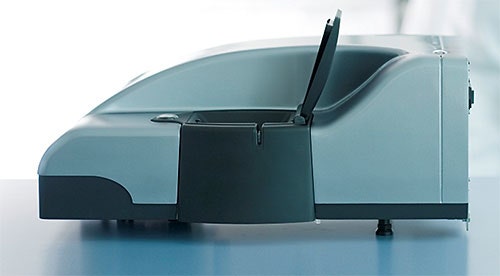
The Zetasizer Nano (Figure 1) is the market leading instrument for making dynamic light scattering (DLS), static light scattering (SLS), and electrophoretic light scattering (ELS) measurements. DLS is routinely used in protein laboratories to measure the hydrodynamic size of proteins in solution; whereas SLS is used to determine their molecular weight. Although SLS is more commonly used in conjunction with size-exclusion chromatography to measure protein molecular weight, it is also capable of measuring molecular weight in a batch or ensemble measurement type. The one proviso in this situation is that the molecular weight from such a measurement is an average of the molecules in the sample so an accurate result requires a very pure sample.
In this application note, two different proteins, human serum albumin (HSA) and Immunoglobulin G (IgG) are measured using a series of SLS and DLS measurements with a Zetasizer Nano system. Using the Debye plot calculators in the Zetasizer Nano software, the molecular weight, 'true' hydrodynamic diameter, second virial coefficient, and DLS interaction parameter are all calculated.
HSA and IgG were prepared in 2 different buffers at pH 4 and pH 7 at a series of known concentrations. SLS and DLS measurements were then performed using the Zetasizer Nano and the results used to generate the SLS & DLS Debye plots.
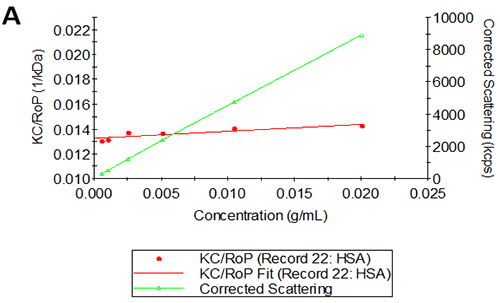
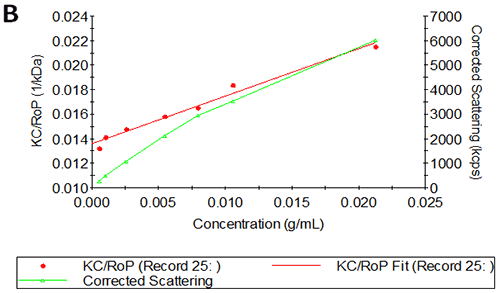
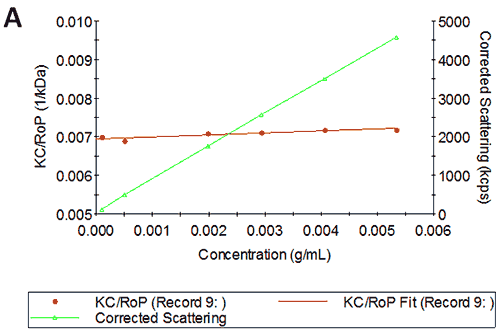
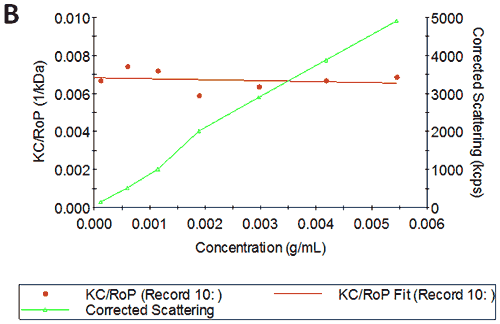
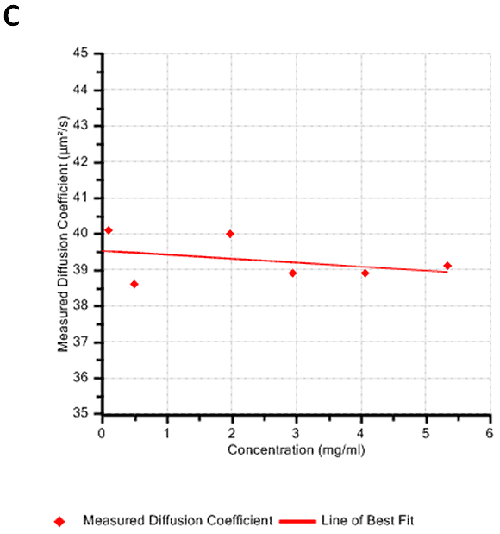
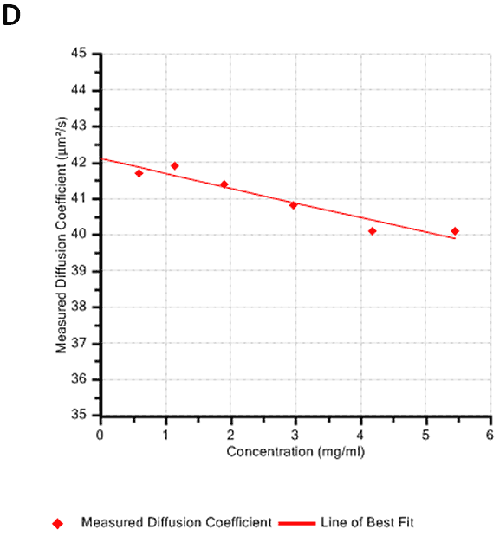
Figures 2A and B show the Debye plots of HSA from the SLS experiments, while Figures 2C and D show the corresponding dynamic Debye plots. The results are summarised in Table 1, which indicates that the measured molecular weight is consistently stable at the two different pH conditions. The determined value of approximately 74 kDa is marginally higher than the theoretical molecular weight (~65 kDa) and this may be attributed to the presence of some oligomers in the sample, which increase the average molecular weight. The value of A2 is significantly different between the two pH conditions. Whilst it is very low at pH 4, A2 increases significantly at pH 7. A similar difference can be seen in kD, with the value increasing from 0.75 mL/g to 8.33 mL/g as the pH is increased from 4 to 7. Taken together, the A2 and kD results for HSA suggest that the sample would be less prone to self-association and aggregation at pH 7 in comparison to pH 4. It is also interesting to note that the increase in HSA A2 & kD values with increasing pH is accompanied by a subtle decrease in the Stokes radius (= RH in the limit of C = 0) from 3.7 to 3.5 nm. It is possible that this relates to a subtle structural change in the molecule but further study would be required to support this.
|
|
|
|
Figures 3A and B show the Debye plots of IgG from the SLS experiments, while Figures 3C and D show the corresponding dynamic Debye plots. The results are summarised in Table 2 and are slightly different from those for HSA. The molecular weight has been measured to be approximately 145 kDa. This is very close to the known value of 150 kDa for IgG suggesting this is a pure sample with minimal oligomers present in the sample. The slight underestimate could be explained by the molecule's sugar component which will slightly affect the dn/dc and thus the measured molecular weight. In this case, when the pH changes, A2 does not change significantly and is very small in both cases - in fact, very near theta conditions, wherein the chemical potential of self-association is exactly balanced by that of solvation. On the other hand, the change in pH is accompanied by a significant change in kD. Here the value goes from being slightly negative to being significantly negative. Since A2 is near zero, this implies a change in the hydrodynamic component of kD.
|
|
|
|
The results above show that both SLS and DLS measurements can be used to study interactions between proteins, as well as simply their molecular weight and hydrodynamic size. Here, the values of A2 and kD can be seen to change in response to a change in buffer pH. It is very likely that this will be accompanied by a change in the formulation behaviour of the proteins, relating to both the stability to self-association and aggregation and the formulation viscosity.
It is particularly interesting to note that the two values, A2 and kD, change independently with the change in pH. In the case of HSA, both values become more positive as the pH is increased. In the case of IgG however, only the kD changes with pH and here becomes more negative as the pH is increased. Further study will be required to understand how these changes in A2 and kD values actually affect the sample behaviour but it is hoped that understanding these values will help in the bioformulation process. Given the increasing number of literature reports showing the successful use of A2 and kD to screen protein formulations ration, it is no wonder that bioformulation researchers are increasingly integrating measurements of these two properties into their early development phase studies.
Mw (kDa) | A2 (ml mol/g2) | Rh (nm) | kD (ml/g) | |
|---|---|---|---|---|
HSA pH4 | 75.4 | 2.80E-05 | 3.7 | 0.75 |
HSA pH7 | 73.5 | 1.93E-04 | 3.5 | 8.33 |
Mw (kDa) | A2 (ml mol/g2) | Rh (nm) | kD (ml/g) | |
|---|---|---|---|---|
IgG pH4 | 144 | 2.49E-05 | 6.2 | -2.76 |
IgG pH7 | 146 | 2.53E-05 | 5.8 | -9.66 |
[1] Moore. "Increasing Formulation Knowledge Space Leveraging Automation" - Keynote presentation at PepTalk2012
[2] Yadav et. al. J Pharm Sci. 2010 (99) 4812-4829
[3] Saito et. al. Pharm. Res. 2011 (29) 397-410
[4] Yadav et. al. J Pharm Sci (101) 998-1011